[fusion_builder_container hundred_percent=”no” equal_height_columns=”no” hide_on_mobile=”small-visibility,medium-visibility,large-visibility” background_position=”center center” background_repeat=”no-repeat” fade=”no” background_parallax=”none” parallax_speed=”0.3″ video_aspect_ratio=”16:9″ video_loop=”yes” video_mute=”yes” overlay_opacity=”0.5″ border_style=”solid”][fusion_builder_row][fusion_builder_column type=”1_1″ layout=”1_1″ spacing=”yes” center_content=”no” hover_type=”none” link=”” min_height=”” hide_on_mobile=”small-visibility,medium-visibility,large-visibility” class=”” id=”” background_color=”” background_image=”” background_position=”left top” undefined=”” background_repeat=”no-repeat” border_size=”” border_color=”” border_style=”solid” border_position=”all” padding=”” margin_top=”0px” margin_bottom=”0px” animation_type=”” animation_direction=”left” animation_speed=”0.3″ animation_offset=”” last=”no”][fusion_text]
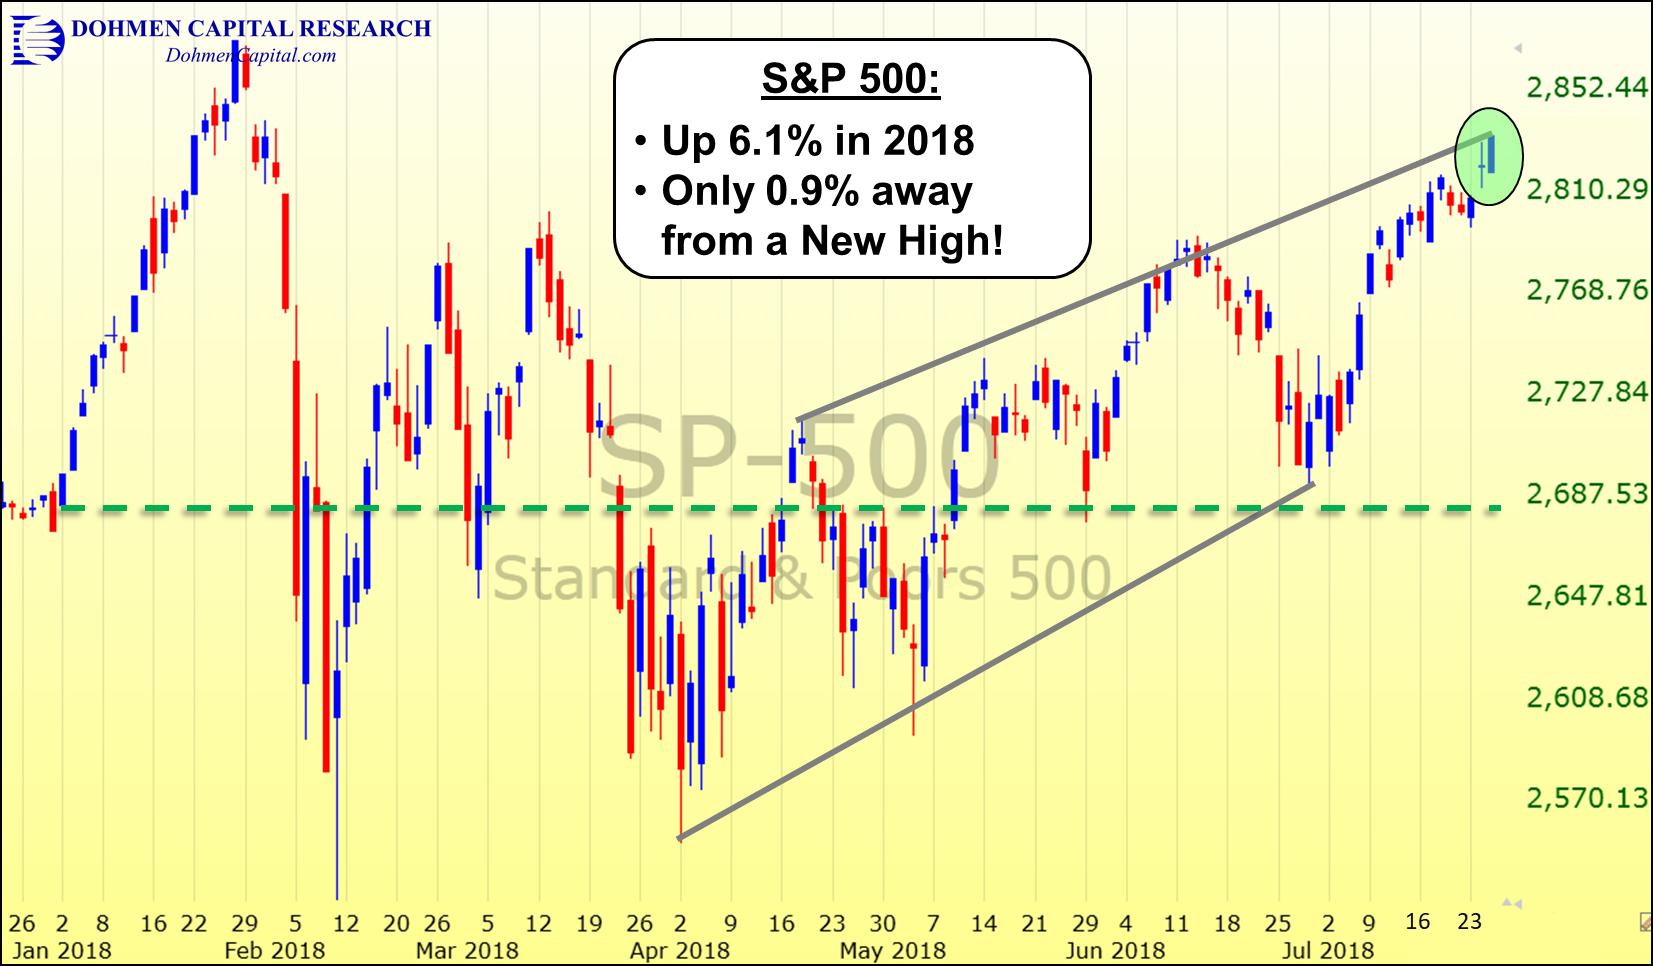
Since the beginning of April, the S&P 500 has been setting higher highs and higher lows. In fact, it just broke out above a key resistance level it set back in March.
But the question traders and investors should be asking themselves is could this be a false up-side breakout or will new highs be reached?
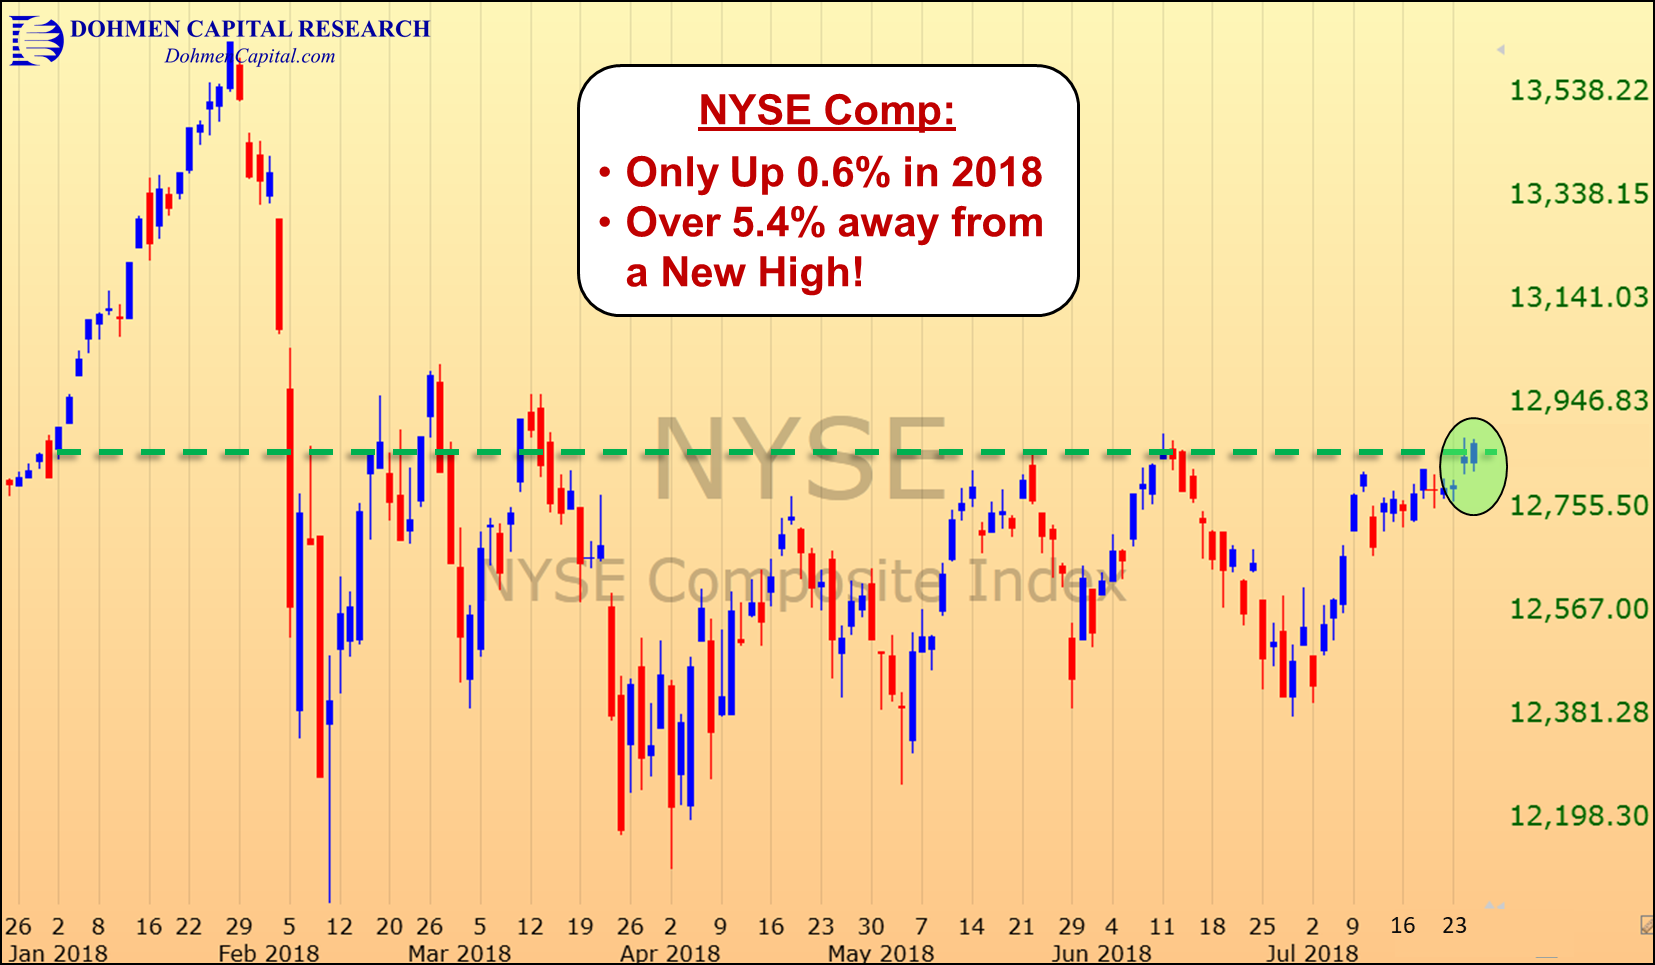
However, just because the S&P 500 is higher, does not mean that the broader market is doing as well.
Compare the chart of the S&P 500 to that of the NYSE Composite, which contains over 2000 stocks and is much more representative of the overall market performance.
The chart below shows that the NYSE has not even been able to recover the levels set in March and currently has a meager 0.6% gain in 2018.
The S&P 500, on the other hand, is approaching its all-time high once again.
If the broader market is underperforming, while a few market indices are doing very well, there must be a few select components of these indices that are driving the markets higher.
Take a look at the table below, which shows the weights of the various sectors that comprise the S&P 500, along with their performance so far this year.
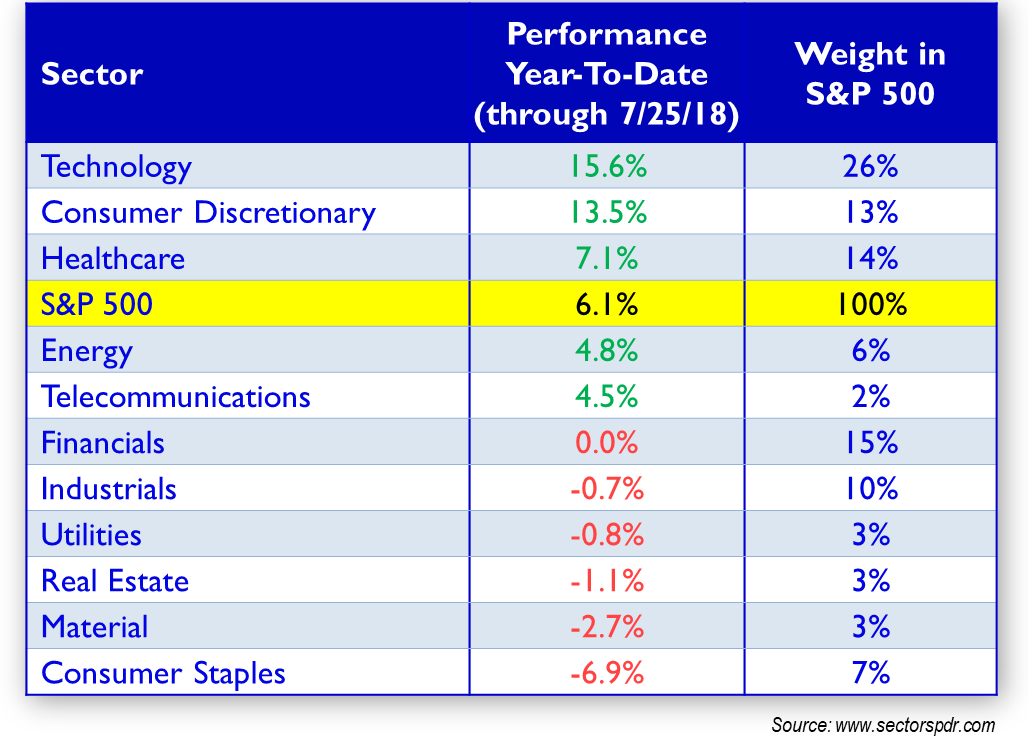
As you can see in the table above, only three of the eleven S&P sectors are currently outperforming the S&P 500 Index. This shows that the majority of sectors are actually underperforming in 2018.
The chart of the Technology sector ETF (XLK) set a new all-time closing high on Wednesday and is up 15.6% this year alone. The Consumer Discretionary sector ETF (XLY) is up 13.5% and also recently hit new all-time highs.
Meanwhile, the S&P 500 is only up 6.1% year-to-date.
However, if you held any of the other eight sectors of the market, you likely would be underperforming the S&P 500 right now and perhaps have accumulated significant losses this year.
Just take a look at the charts of some of the weakest sectors including Consumer Staples (XLP) and Materials (XLB) versus the best performers mentioned above.
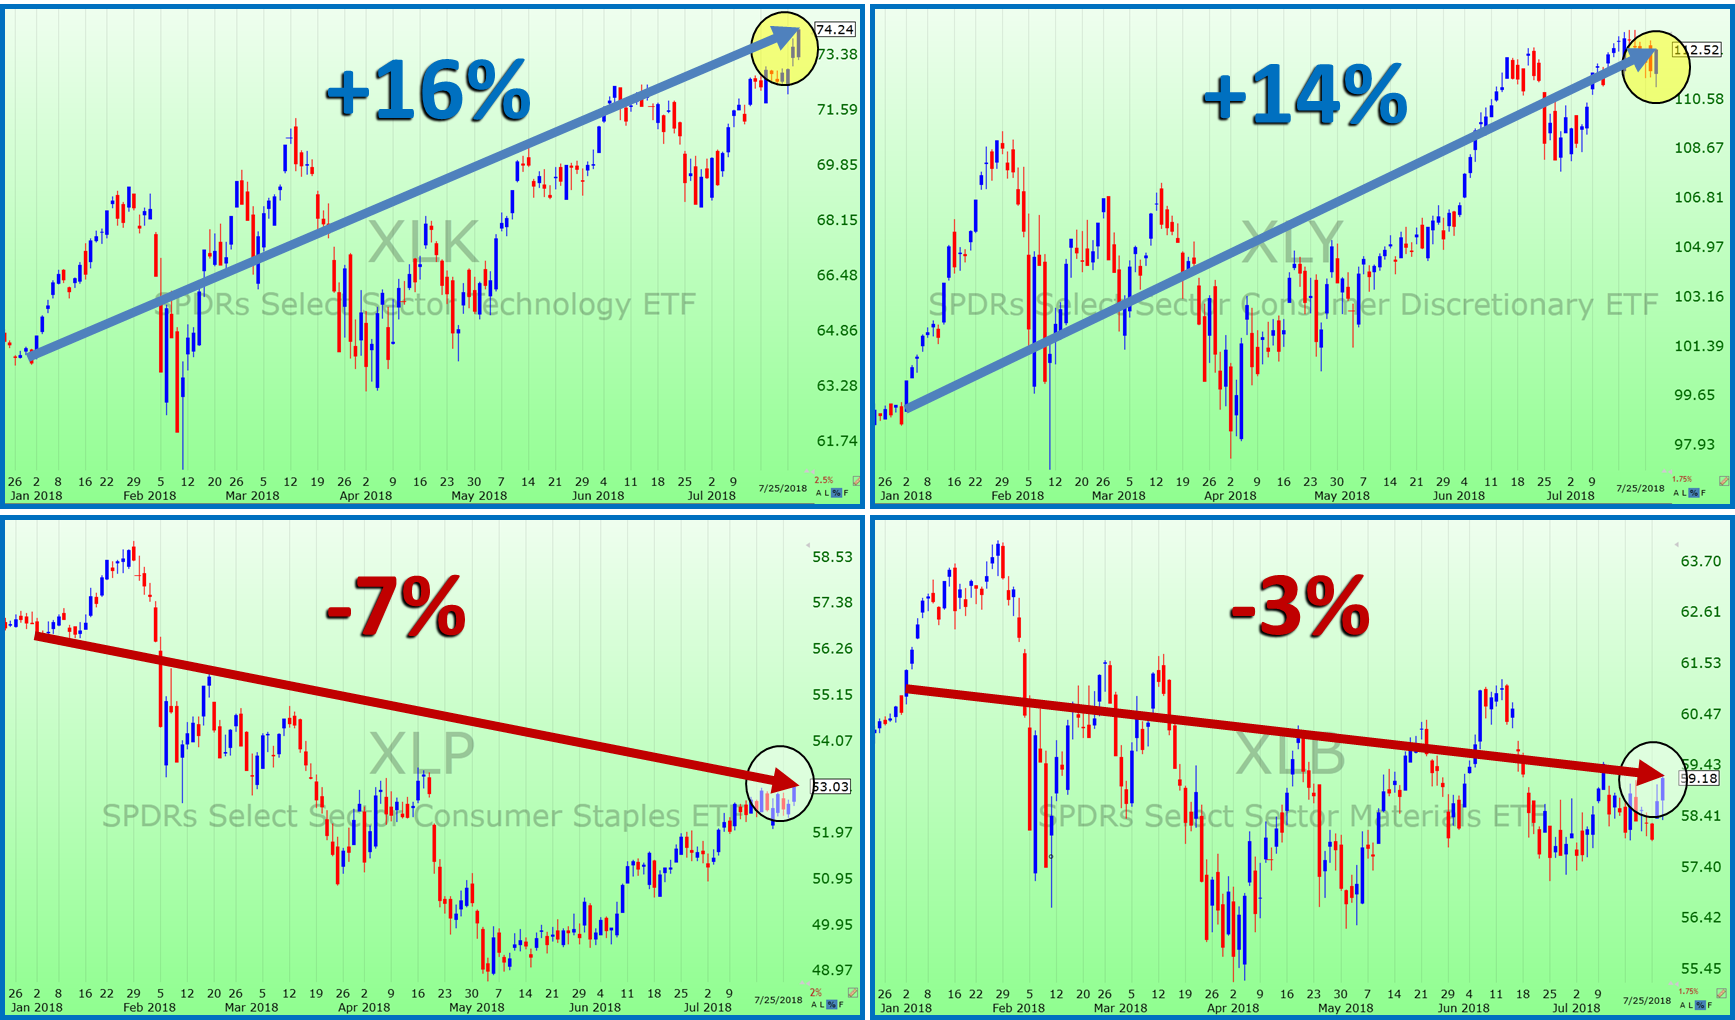
The charts show that selecting the right ETFs with astute market timing can tremendously help your trading strategy and can allow you to outperform the market in both bullish and bearish environments.
In fact, there are a number of ETFs within the best performing sectors that have even better performance, which we recommended in our Fearless ETF Trader earlier this year and also currently hold at this time.
Instead of using the old “buy and hold” long term approach with your portfolio, why not try trading ETF’s to help enhance your performance and provide diversification among specific sectors and geographic regions?
A big advantage of trading ETFs is that they can help you participate on the upside when the markets are climbing higher but also protect you from huge sudden plunges when markets plummet.
Many investors seem to be convinced that putting your money in an index fund is the best use of your funds.
However, trading specific ETFs can provide the ideal combination of higher returns than broad market indices and lower risk than individual stocks.
When the markets become more precarious, and when our research suggests that a bull market is in the topping stage, We prefer ETFs because of the lower risk they offer.
And when the market does begin to topple over again, as it did in late January-early February, we can recommend inverse ETF’s to our clients, which help you profit from market downturns and bear markets.
Our Fearless ETF Trader is ideal for this current market environment. We will tell you which ETFs to buy and when, along with which sectors may be ready for a decline, making the ‘inverse’ ETFs for that sector attractive. We even tell you when to stand on the sidelines if the signals are neutral.
And at times, we may have ETFs on the bullish side and others on the bearish side. Yes, sometimes having exposure to both sides is very profitable.
Wishing you successful trading,

Bert Dohmen, Founder
Dohmen Capital Research
Dohmen Strategies, LLC
[/fusion_text][/fusion_builder_column][/fusion_builder_row][/fusion_builder_container]
 - Dohmen Capital Research")