
(Written by Bert Dohmen, contains excerpts from our latest Wellington Letter issue)
This year has been the “Year of Great Deceptions,” as we have frequently pointed out. The market has been deceptively promoted as having big gains in 2023. Yet, the naïve investors and money managers were all fooled.
We hear all the time that the market has been booming this year and “defensive investors” who were cautious would have missed a great opportunity. That is so false!
Investors were not told the truth, except by us and some other private analysts, about how all the gains in the cap-weighted S&P 500 were due to just 7 stocks (the “Magnificent 7”) out of the 500 stocks in the index. The other 493 S&P stocks together were flat. What a scam!
We have repeatedly shown the chart of the “equal weight” S&P 500 (SPEW Index), where each stock has the same weight regardless of the capitalization of the firm.
Here is a weekly chart going back to the October 2022 lows comparing the two indices. The cap-weighted S&P 500 (blue line) has fallen back to the same level it was at in May of this year. However, the equal weighted S&P 500 (SPEW Index, red line) is now trading at a new low for 2023 and is now back to the same level it was at over one year ago!
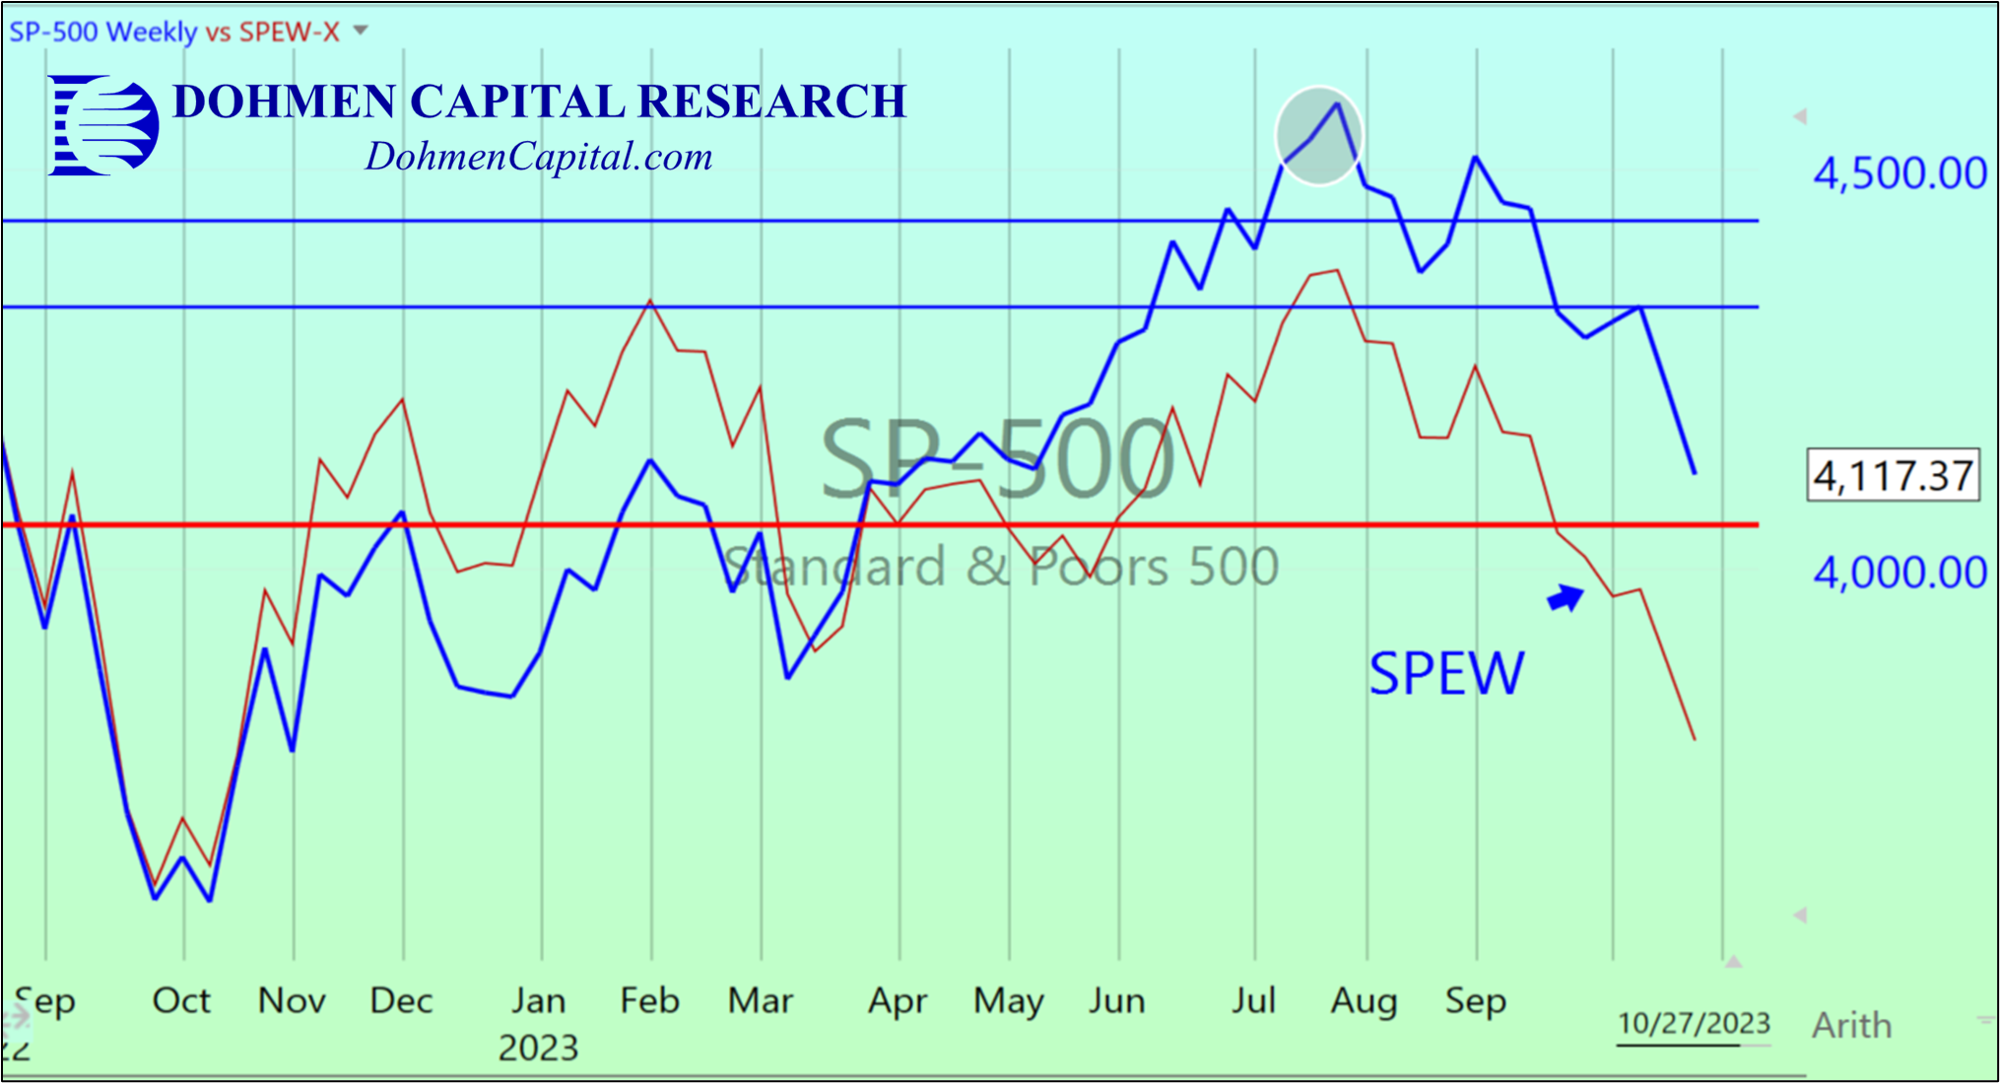
The important thing when investing and looking at longer-term charts is to focus on the big trend instead of day-to-day chop when it occurs. There is an old motto, “the trend is your friend.”
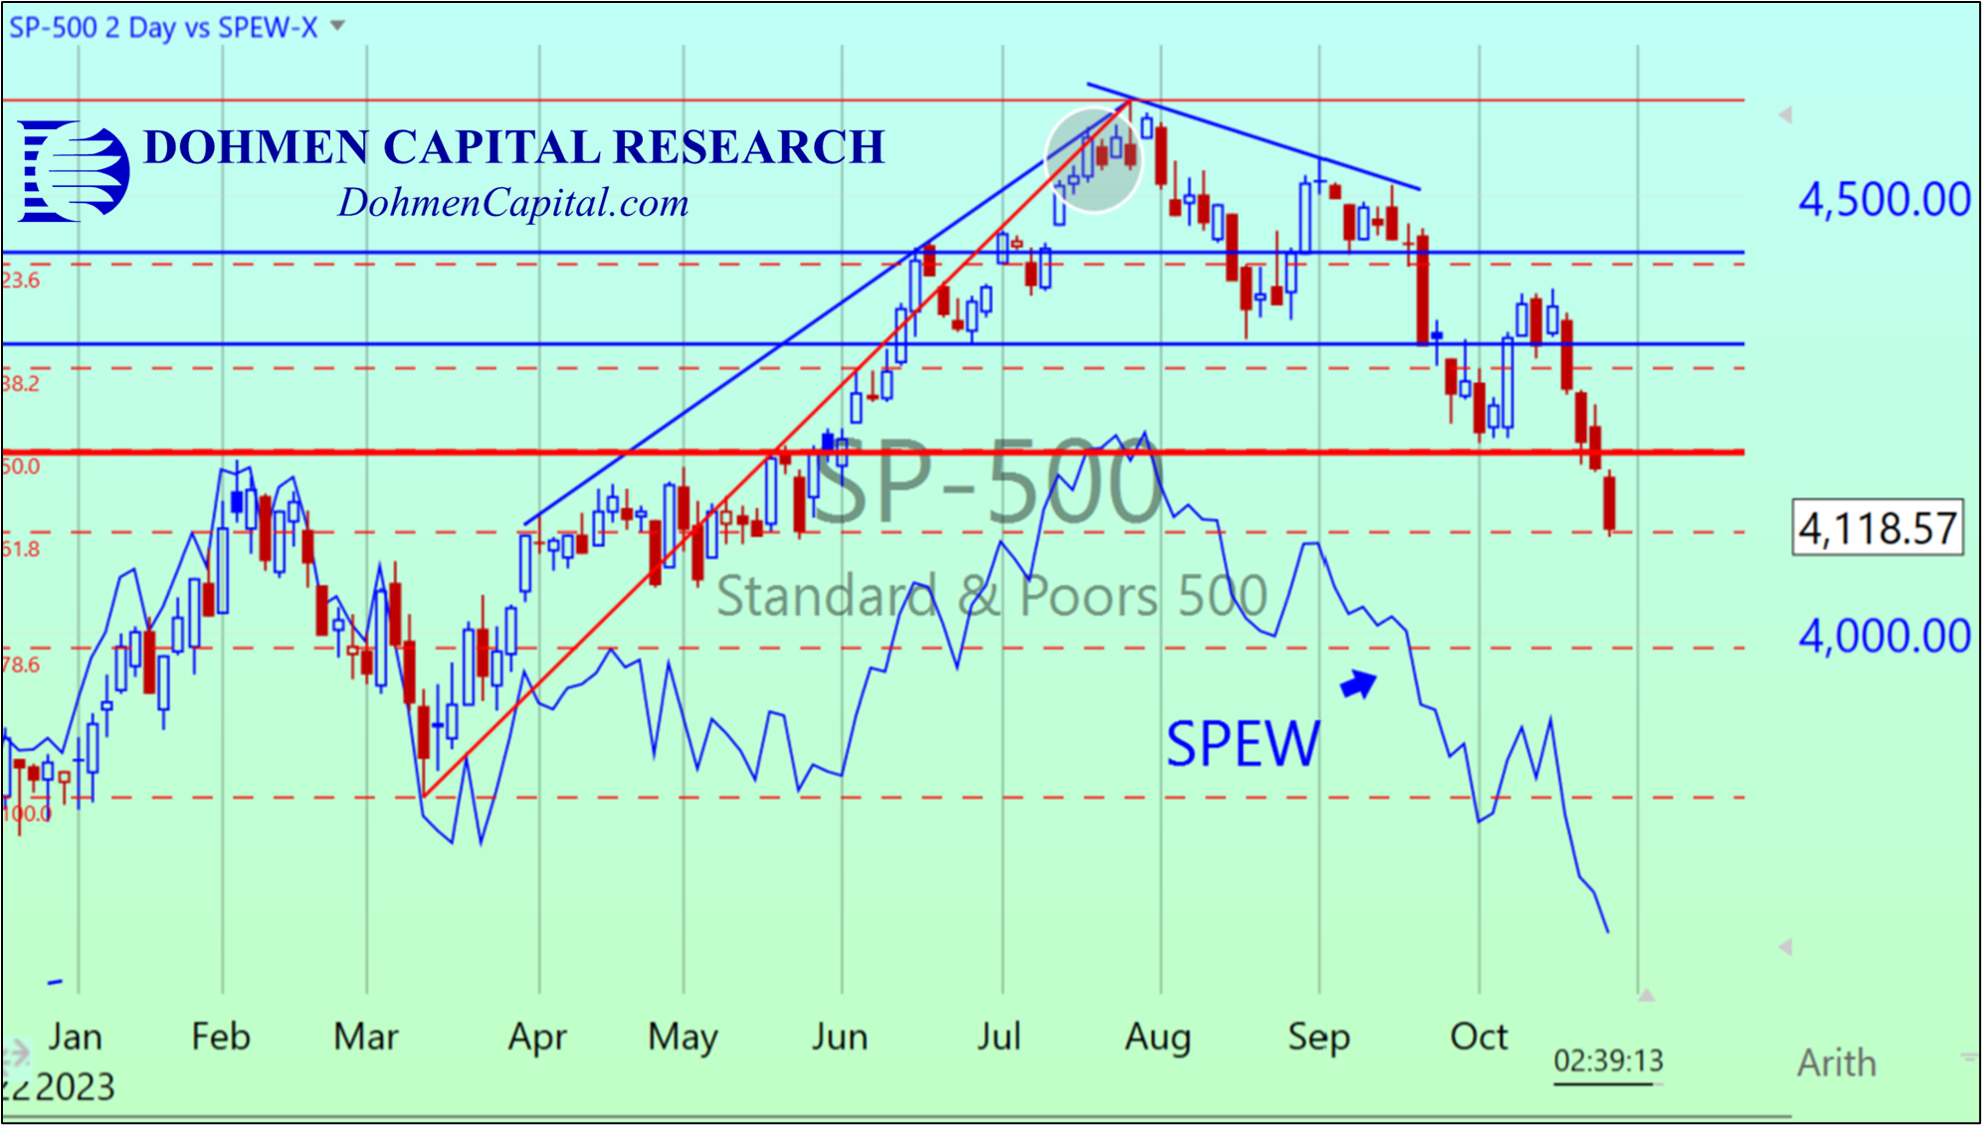
Below is the 2-day chart of the above comparison since the start of this year. The S&P 500 (candlesticks) hit another mild Fibonacci support level last Friday (October 27, 2023). That may produce a bounce.
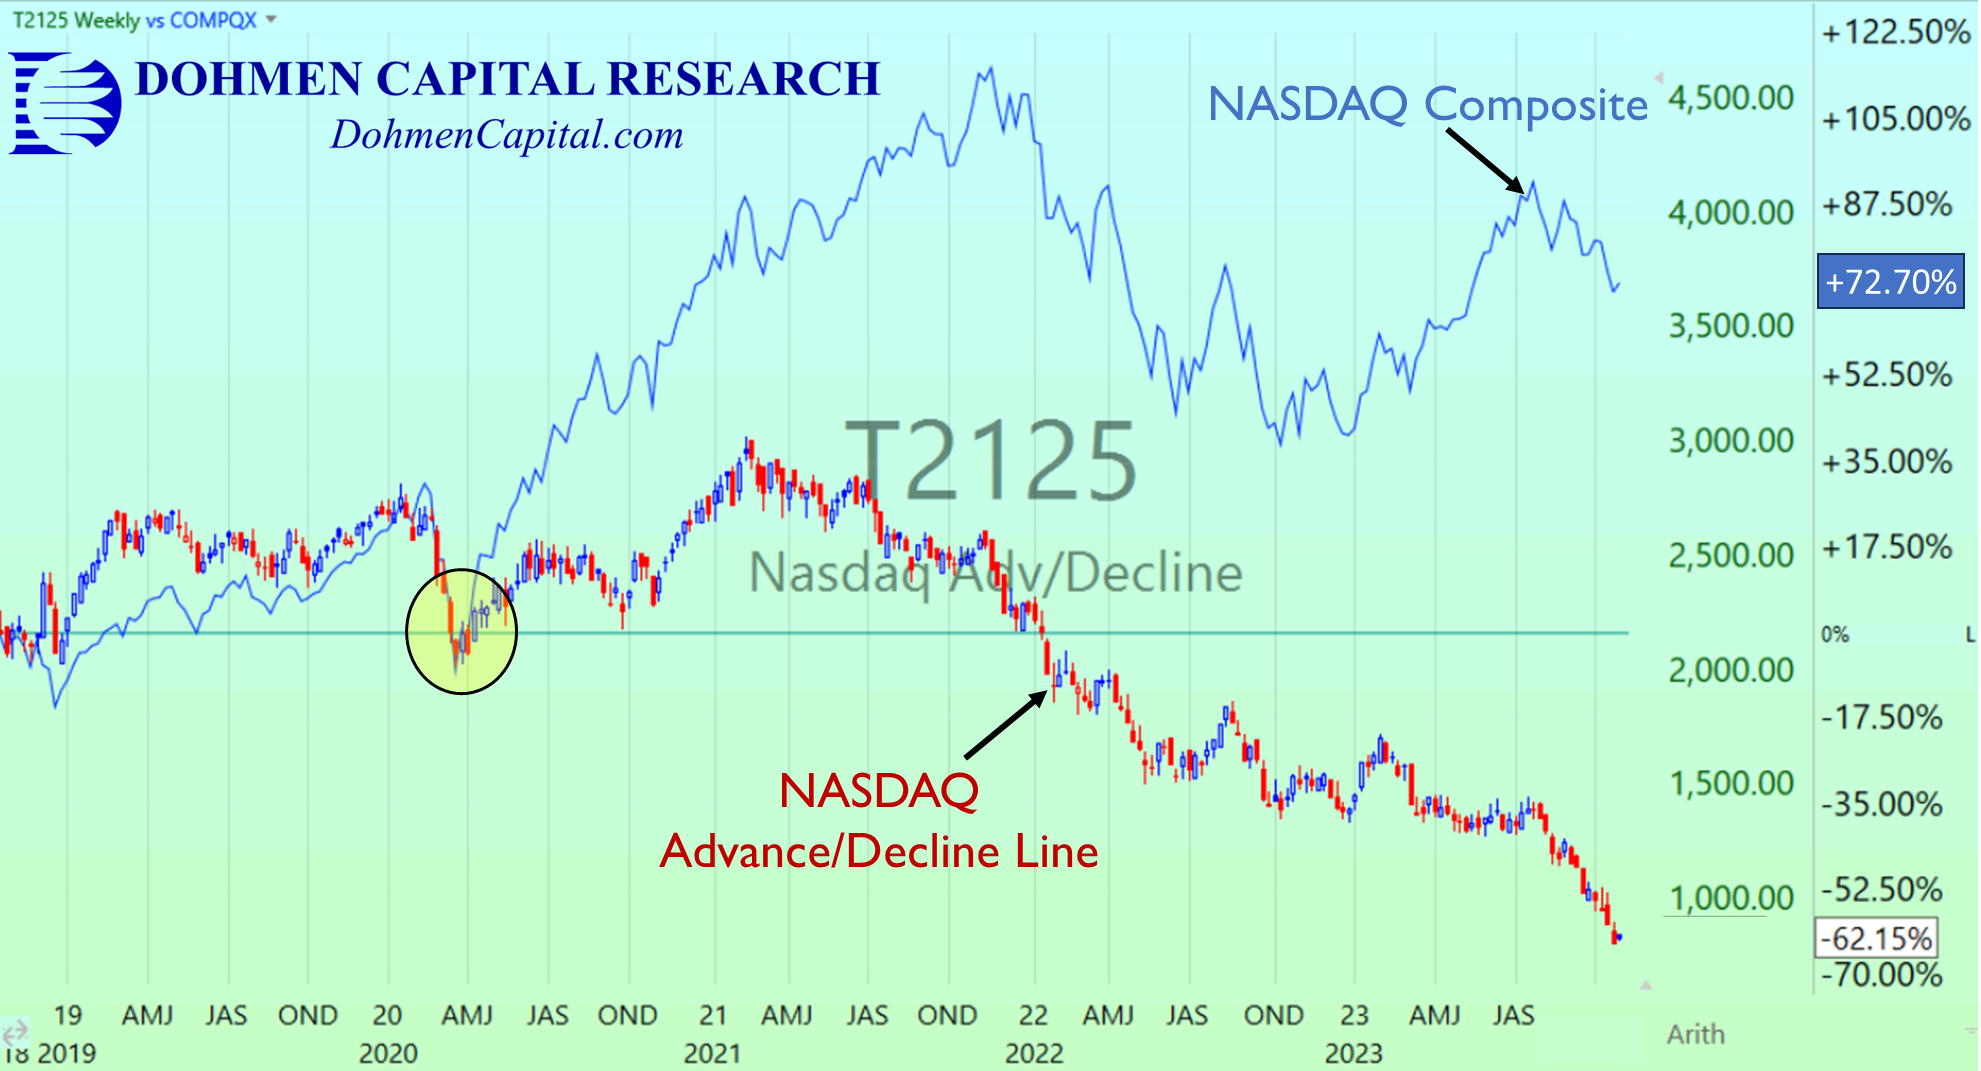
Looking at a different index, the chart of NASDAQ Composite (blue line) vs. the advance/decline ratio of the NASDAQ (candlesticks) clearly shows that the majority of tech stocks (the A/D line) have been declining significantly.
That doesn’t look like a bull market, although some analysts still insist that you must “buy stocks now in order not to miss the next up-move.” Really?! Our advanced technical analysis says the the worst is still ahead.
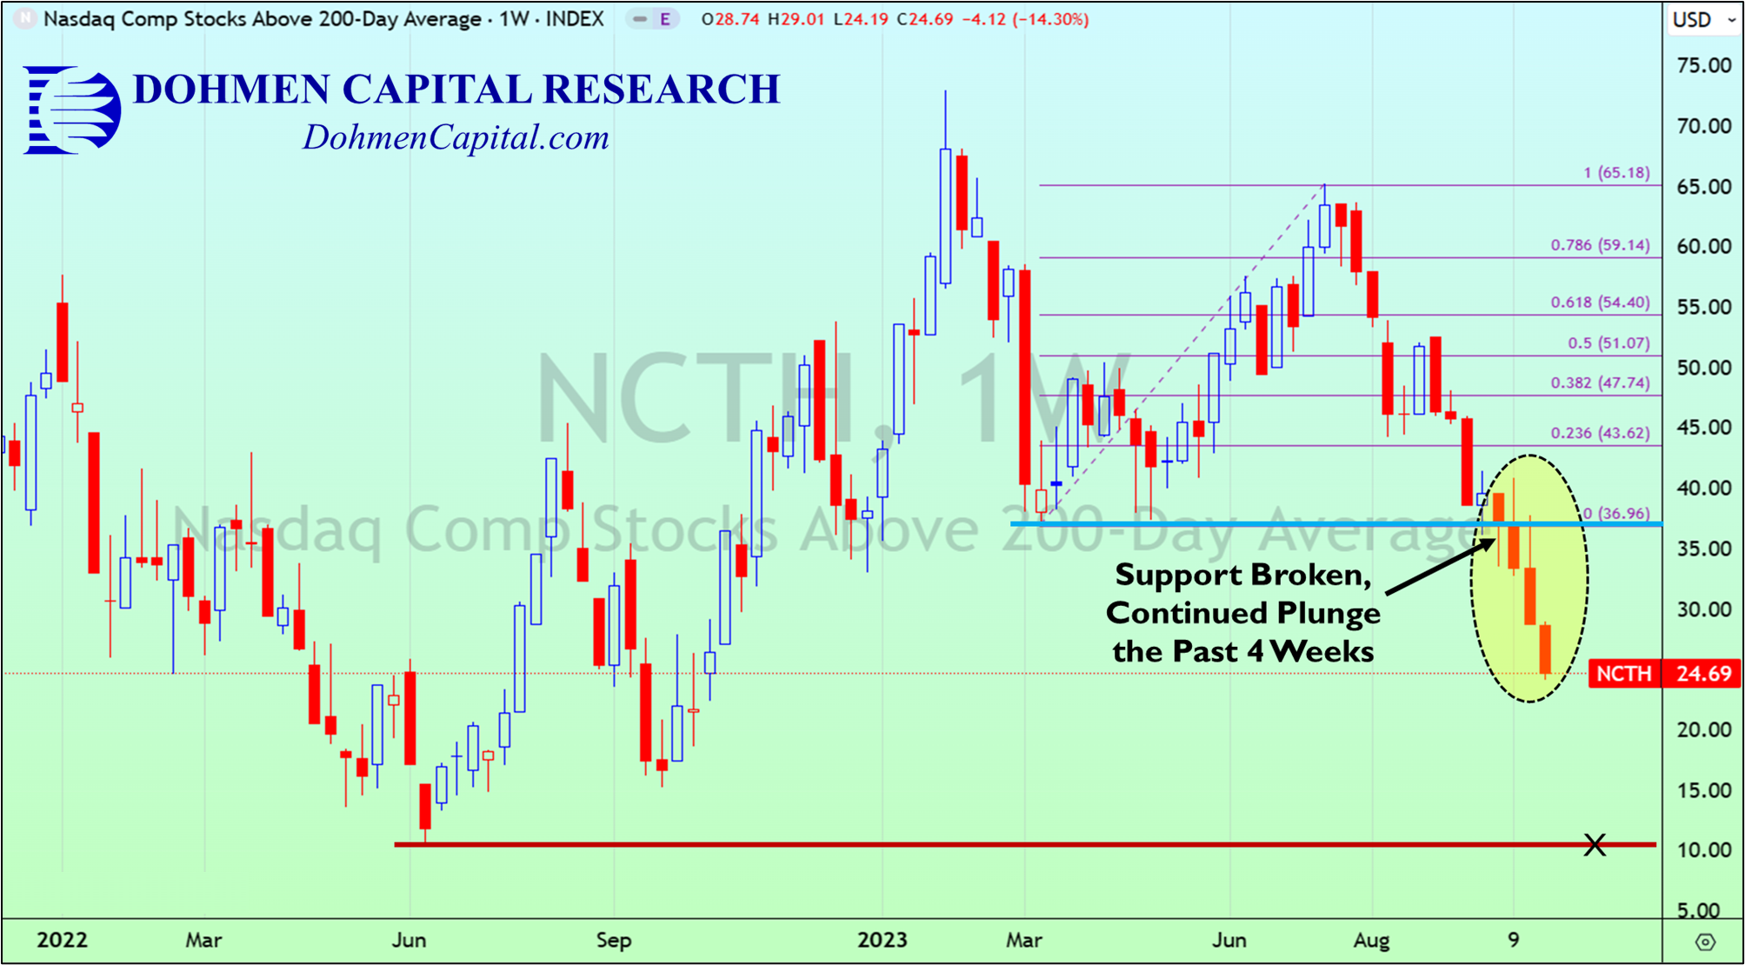
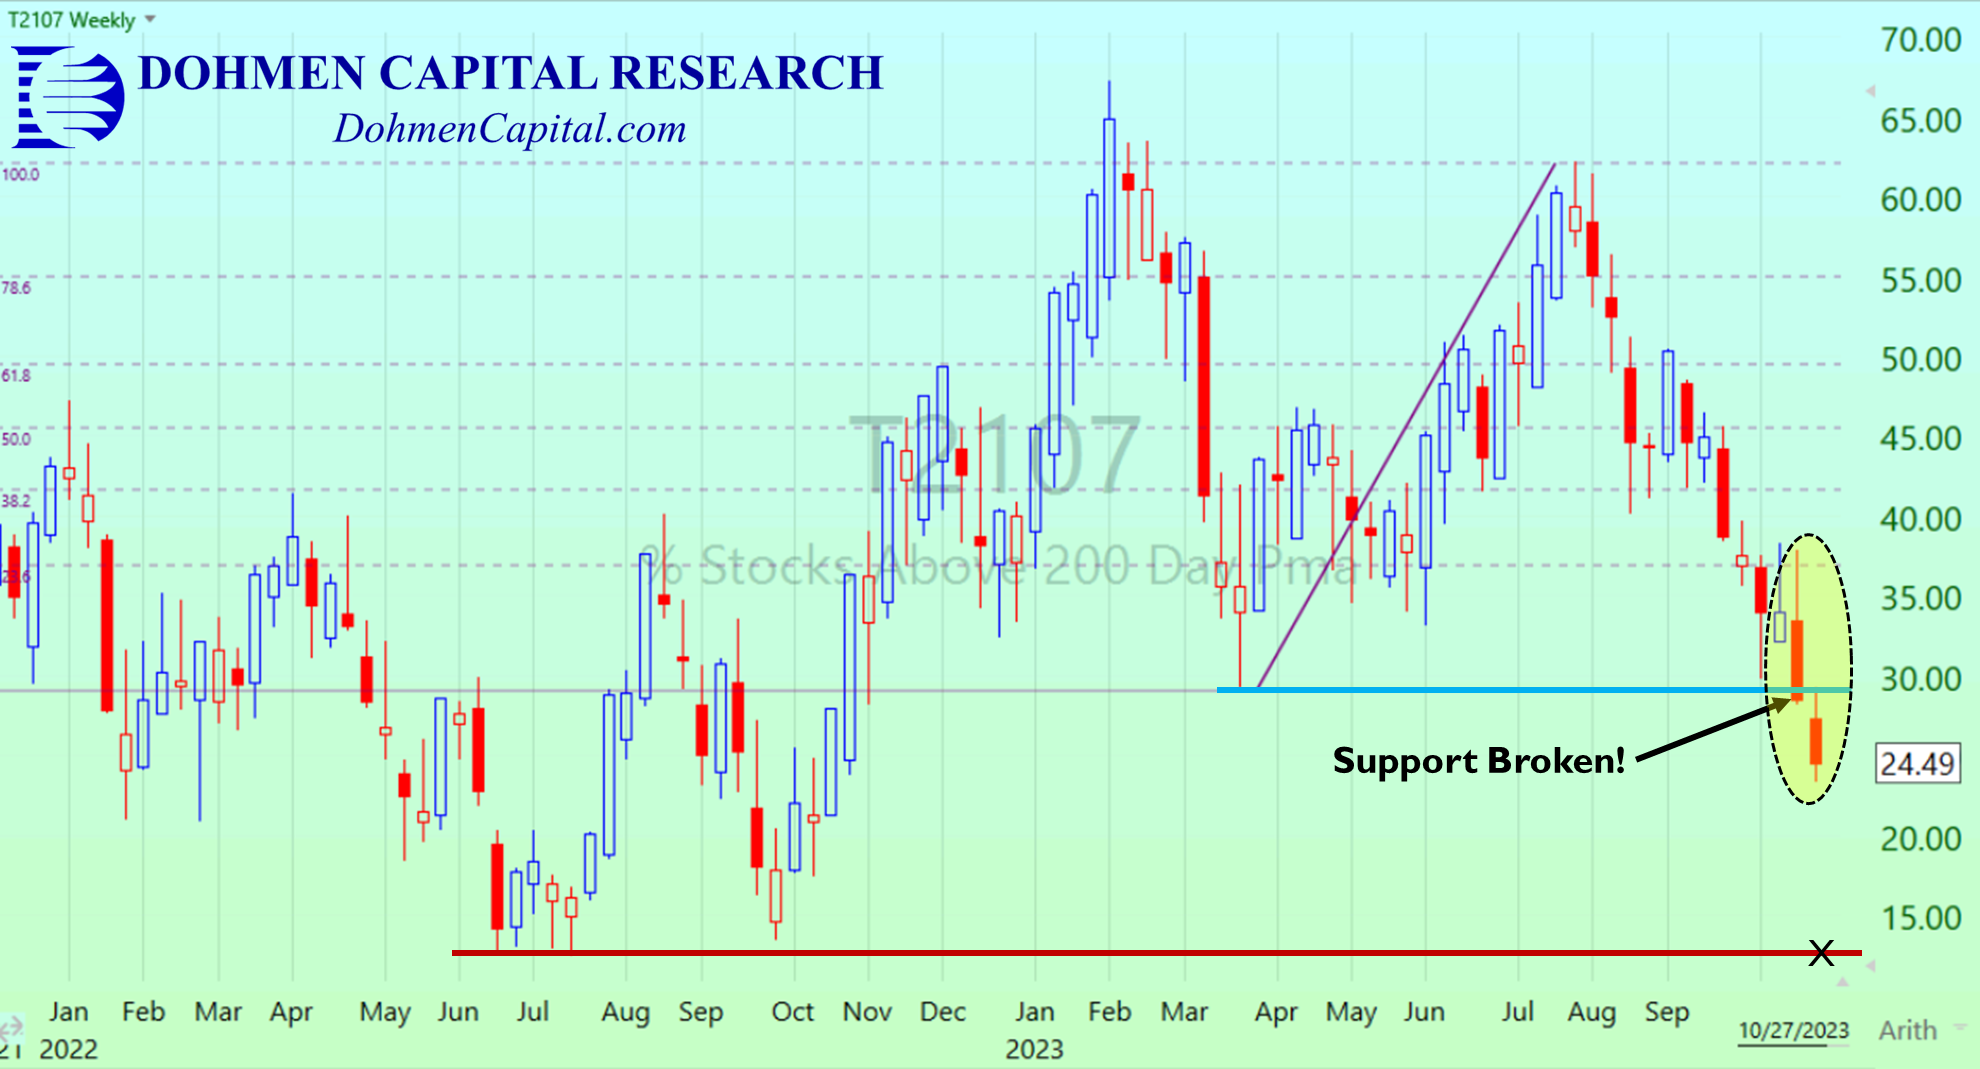
To further illustrate just how poorly the broader group of tech stocks have performed, we look at the weekly chart of the “% of NASDAQ Comp Stocks Above Their 200-day M.A.” indicator below. On Friday, October 27th it fell to just over 24% of NASDAQ stocks above their 200-day m.a.
Look at this chart carefully as it shows what many tech stocks have been doing this year. It cannot easily be manipulated. For us that means that about 76% of stocks are in bear markets.
Notice how it broke support from its March lows in early October (light blue horizontal line, yellow shaded area) and has continued to plunge over the past 4 weeks. We should see the indicator eventually fall to the June 2022 lows (red horizontal line, “x”) before any sort of stronger support comes in.
Now we’ll look at how the broader stock market (NYSE) has been performing with the weekly chart of the “% of Stocks Above Their 200-day M.A.” indicator below. Notice how it also broke support from its March lows recently (light blue horizontal line, yellow shaded area).
Currently just over 24% of stocks on the NYSE are trading above their 200-day m.a., similar to the NASDAQ above. Our next downside target for this indicator is the red horizontal support line (“x”), which is the June-October 2022 lows.
CONCLUSION: For weeks we have said in our Wellington Letter as well as in our shorter-term trading services (Smarter Stock Trader and Fearless ETF Trader) that the chart patterns and the heavy selling strongly suggest that the next declining phase of the market could be severe, even worse than the one we saw in 2022.
This is a time to ignore some of the manipulated short-term bounces of a few individual stocks, as well as the opinions of the bulls who work for money management firms. They have serious conflicts of interest.
We suggest focusing on the major trends of the most relevant market indices. The short-term pops are designed to distract.
While the financial media and money managers proclaim stocks have had a good year this year, the major market indices have been slicing through important support levels almost like a hot knife through butter.
In the not-too-distant future this will lead to a sharp market plunge as the bullish money managers finally give up, realizing that many of the economic stats they relied on were deceptive and worthless.
We still look at the possibility of big “tax-loss selling” when money managers sell all their big losers before year-end in order not to show them in their year-end reports to their clients. This would provide more fuel for the selloff.
Our motto has been for 47 years, “Timing Is Everything.” Consider leaving the gullible crowd and joining our “Winning Minority” today.
Wishing you successful investing
Bert Dohmen
Founder, Dohmen Capital Research
P.S. To learn about the opportunities we see in the market heading into year-end and beyond read our latest award-winning Wellington Letter, titled “Market Deterioration Accelerates” (published October 29th) by signing up today at DohmenCapital.com.
Members gain instant access to our latest issue along with all other Wellington Letters we published over the past two months. Join us today!