
About 7 weeks ago, on April 16, we wrote to our Wellington Letter members:
“Gold is still near term bullish. But beware of a potentially strong correction. The probability is high that the 2020 high will be reached and perhaps briefly exceeded. Old highs, the further back in time, are big resistance for a while. Based on technical rules, after the old high is reached, there could be a strong correction in Gold.”
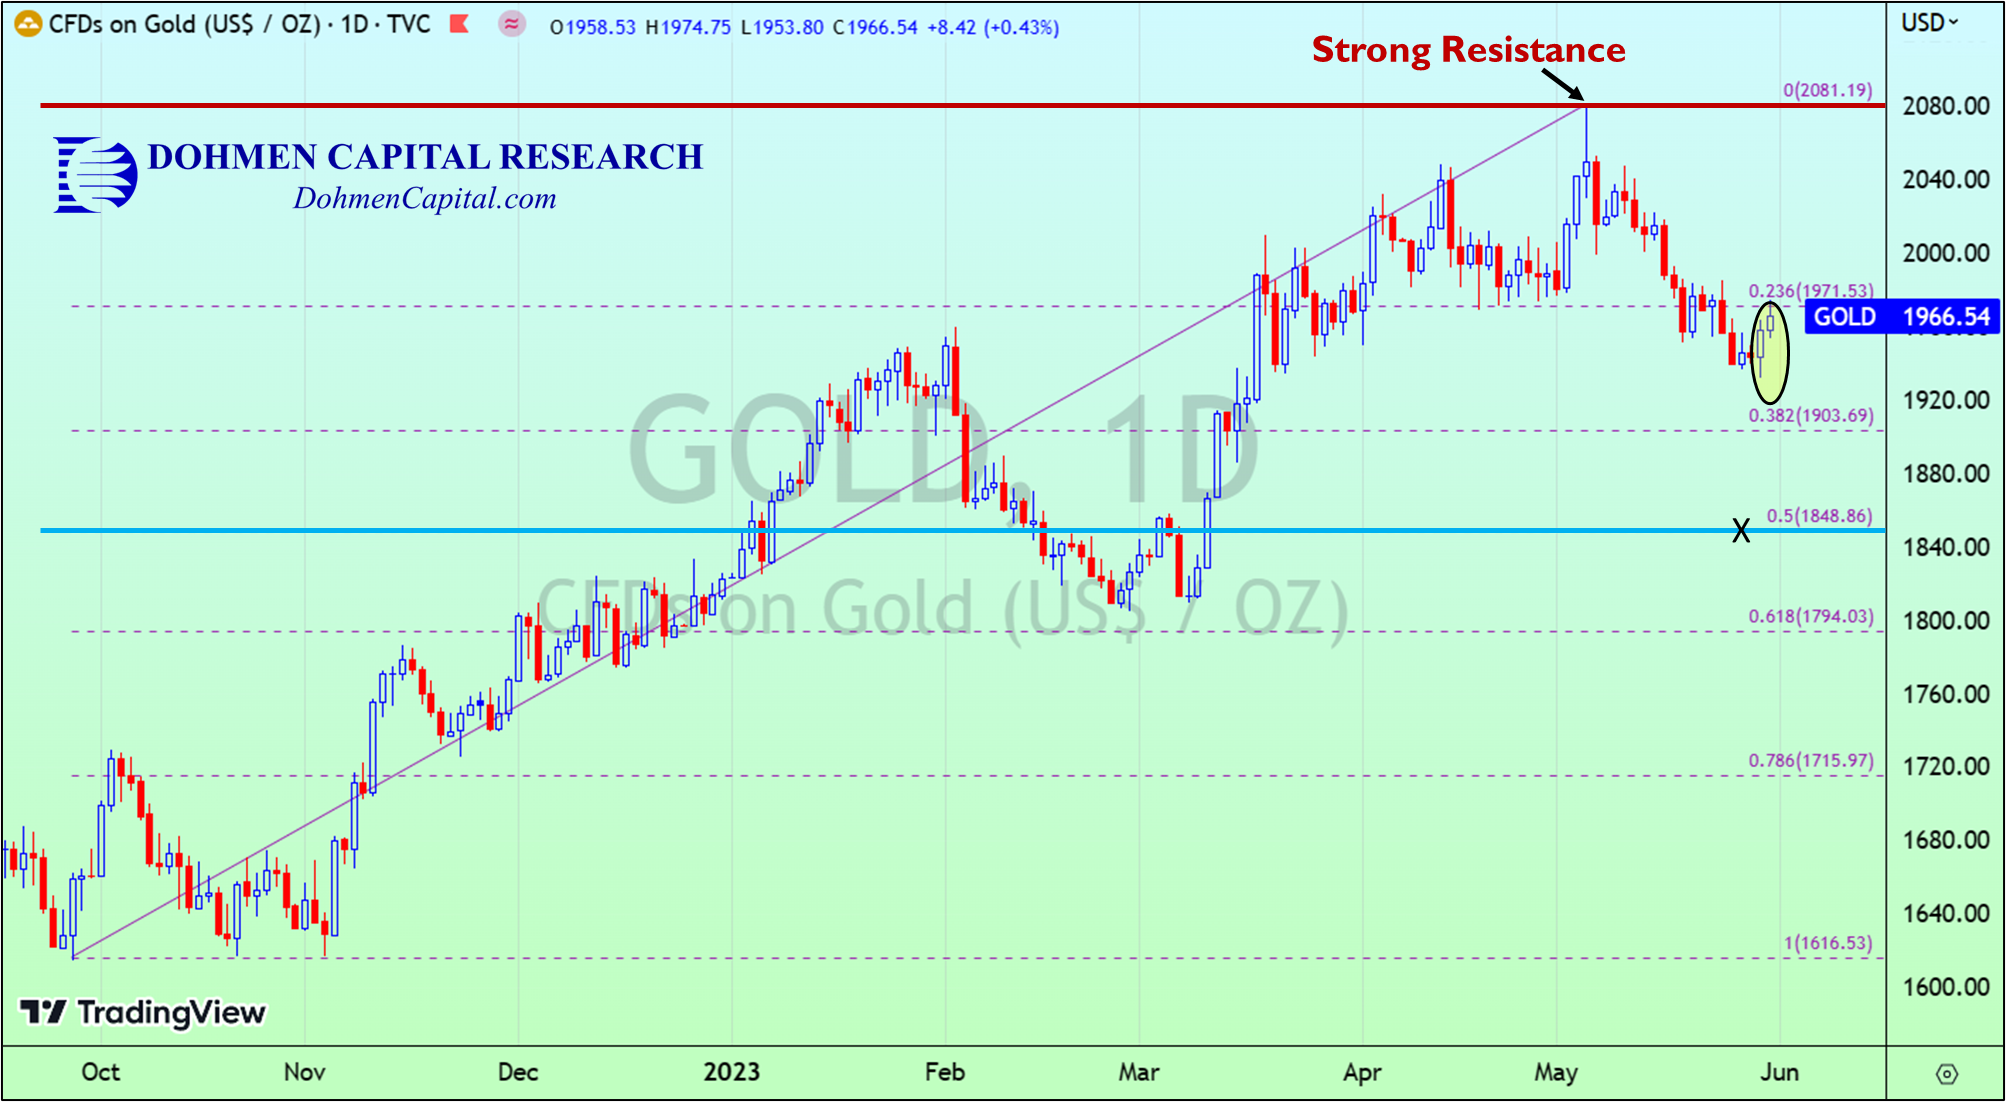
That is exactly what happened. On May 4th, the price of Gold climbed to a high of around $2081/oz, briefly surpassing the August 2020 high.
After reaching that new high, Gold plunged over the next three and a half weeks and lost roughly $150 per ounce through the May 30th low.
On the daily chart of Gold below, the red resistance line, which we drew several weeks ago, is the August 2020 high we warned about. Our potential first downside target is the blue horizontal line, marked as “x.” That would be another $100-$120 down from here.
Always remember, the markets are a game, aimed to take money from the emotional investors and give it to the big smart money that controls the markets. The media is complicit in this.
Corrections in gold can be as much as 10%, or more. Our target (“x”) on the chart above is around that area. The nervous greedy traders who bought leveraged gold and gold miners ETFs will usually sell at the bottom, where the smart money is ready to pick up the bargains in unleveraged vehicles.
If you missed selling Gold after it hit strong resistance from its previous high, it is now your responsibility to adjust as best you can.
At Dohmen Capital Research, we believe Gold investors must take the very long-term view, not weekly or monthly, and think about why they expect gold to rise. Is it because next week there could be a crisis and you may make some money in a week? Or is to protect your assets against a long-term intentional reduction of the purchasing power of your currency, and all currencies?
Our choice would be the latter.
The long-term charts for Gold are still long-term bullish, as we have written many times in our research services as well as in articles posted here on ZeroHedge.
In 1980, we did a cycle study of gold going back about 400 years. Of course, we had to go back to the early years in England. The cycles predicted a 20-year bear market starting in 1980, to be followed by a 30-year bull market starting in the year 2001.
We exited gold at $694/oz in 1980. A huge bear market followed.
Cycles usually shift slightly to the right or left, but this time the bear market in gold was exactly 20 years. The low was around $250/oz in the year 2000. Our members had great opportunities short selling gold or the mining stocks up until that time.
Then in 2001, the new “secular” bull market started. Our cycle study forecast was right on target.
In 1980, when our cycle research said the bear market would be followed by a 30-year bull market, we said we didn’t know what would cause that. Now we know: it is the irresponsible policies of the major central banks. They will fabricate as much phony money as is necessary to try to prevent a depression. And that causes inflation.
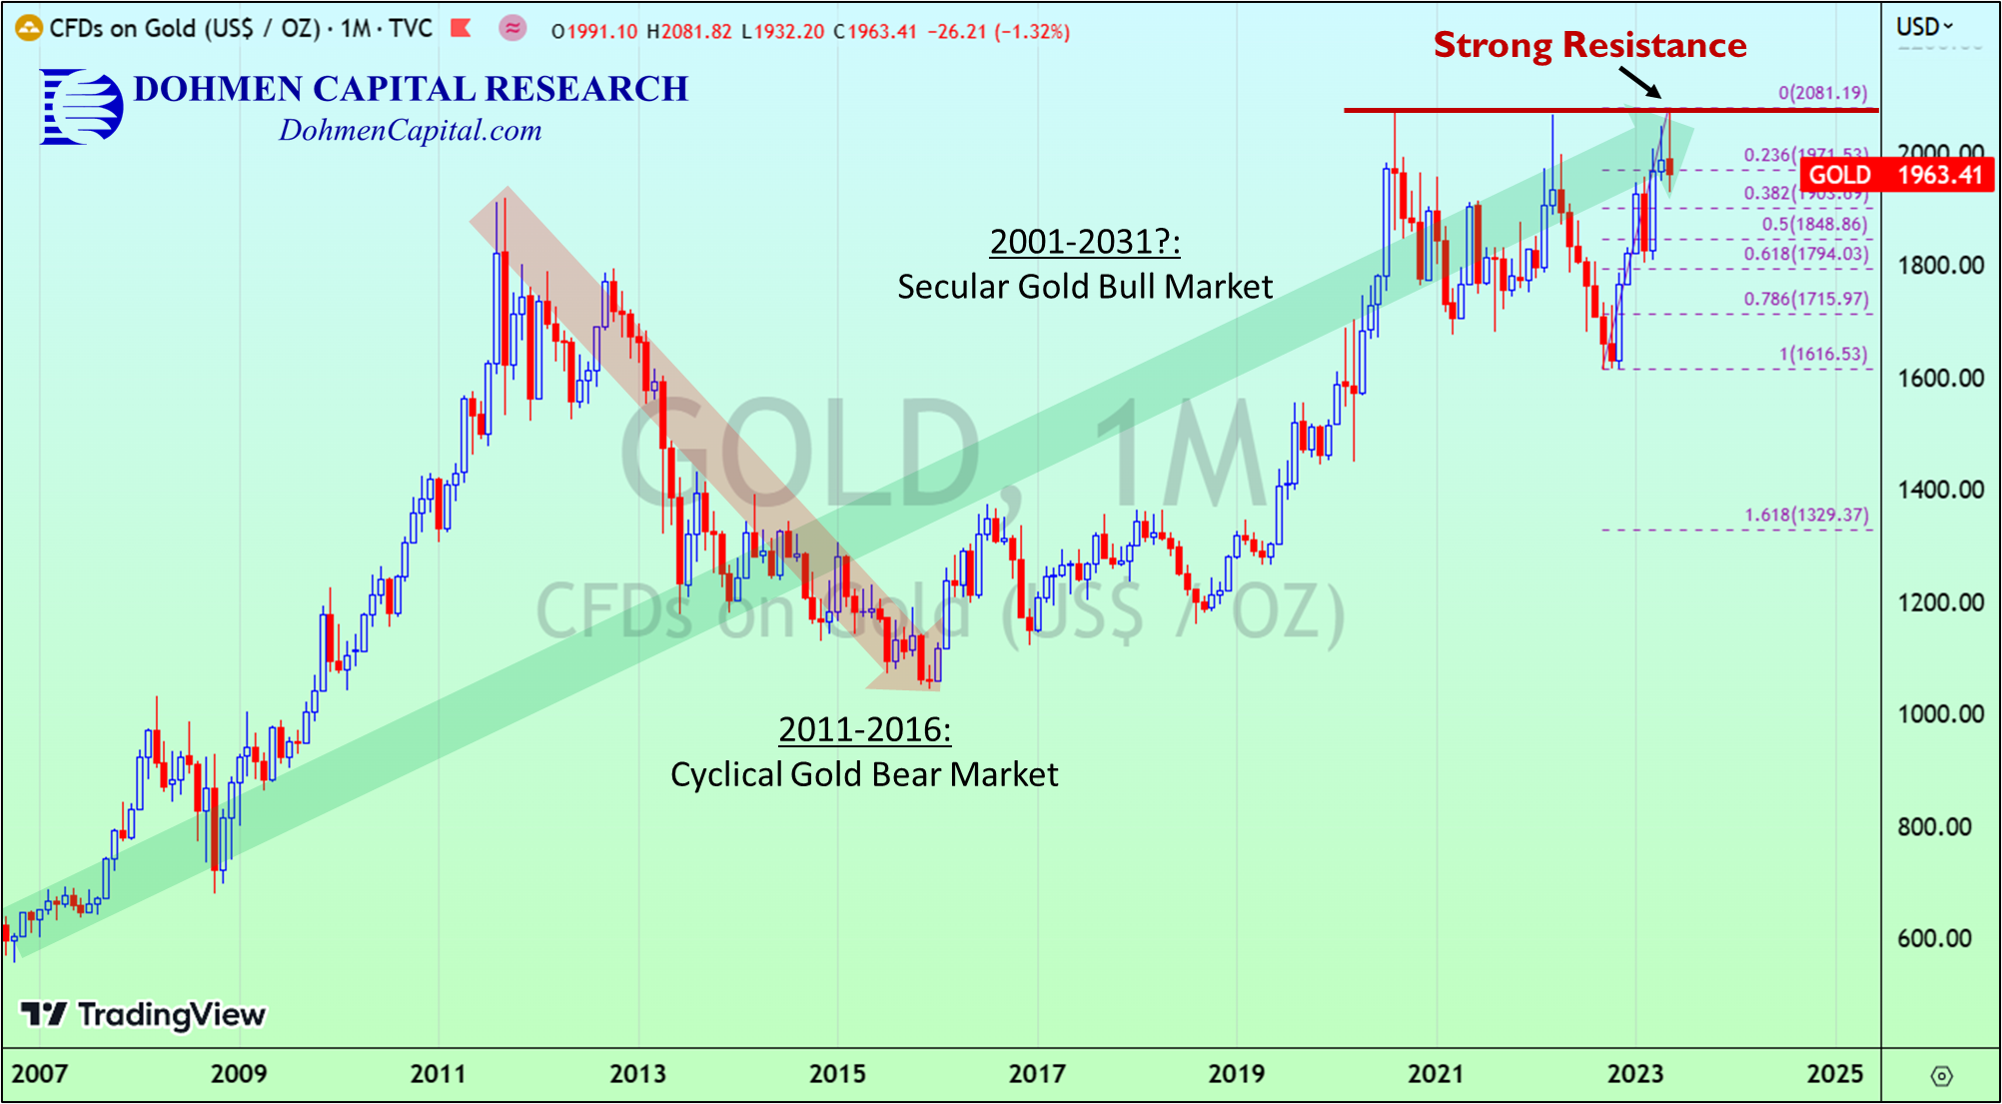
However, in secular bull markets, there are “cyclical” (shorter term) bear markets. In gold, we saw one from 2011 to 2016, within the secular gold bull market. The charts and our work suggest that the secular bull market that started in 2001 is still “operative” and could last until about 2030-2031.
See the monthly long-term chart of Gold below.
A big correction in the near term will present a greater buying opportunity for when the central banks panic and try to rescue the financial system.
If our signals confirm that the current decline in Gold turns out to be a “correction” and not a new cyclical bear market for gold, the secular gold bull market is still intact. After gold breaks out to a new high, the potential upside target in a “measured” move would then be $400-$500 above the breakout level.
The weekly comparison chart below shows how the Gold miners ETF (GDX, candlesticks) is significantly lagging the price of gold (GLD, blue line). That is bearish behavior and suggests more of a correction is ahead.
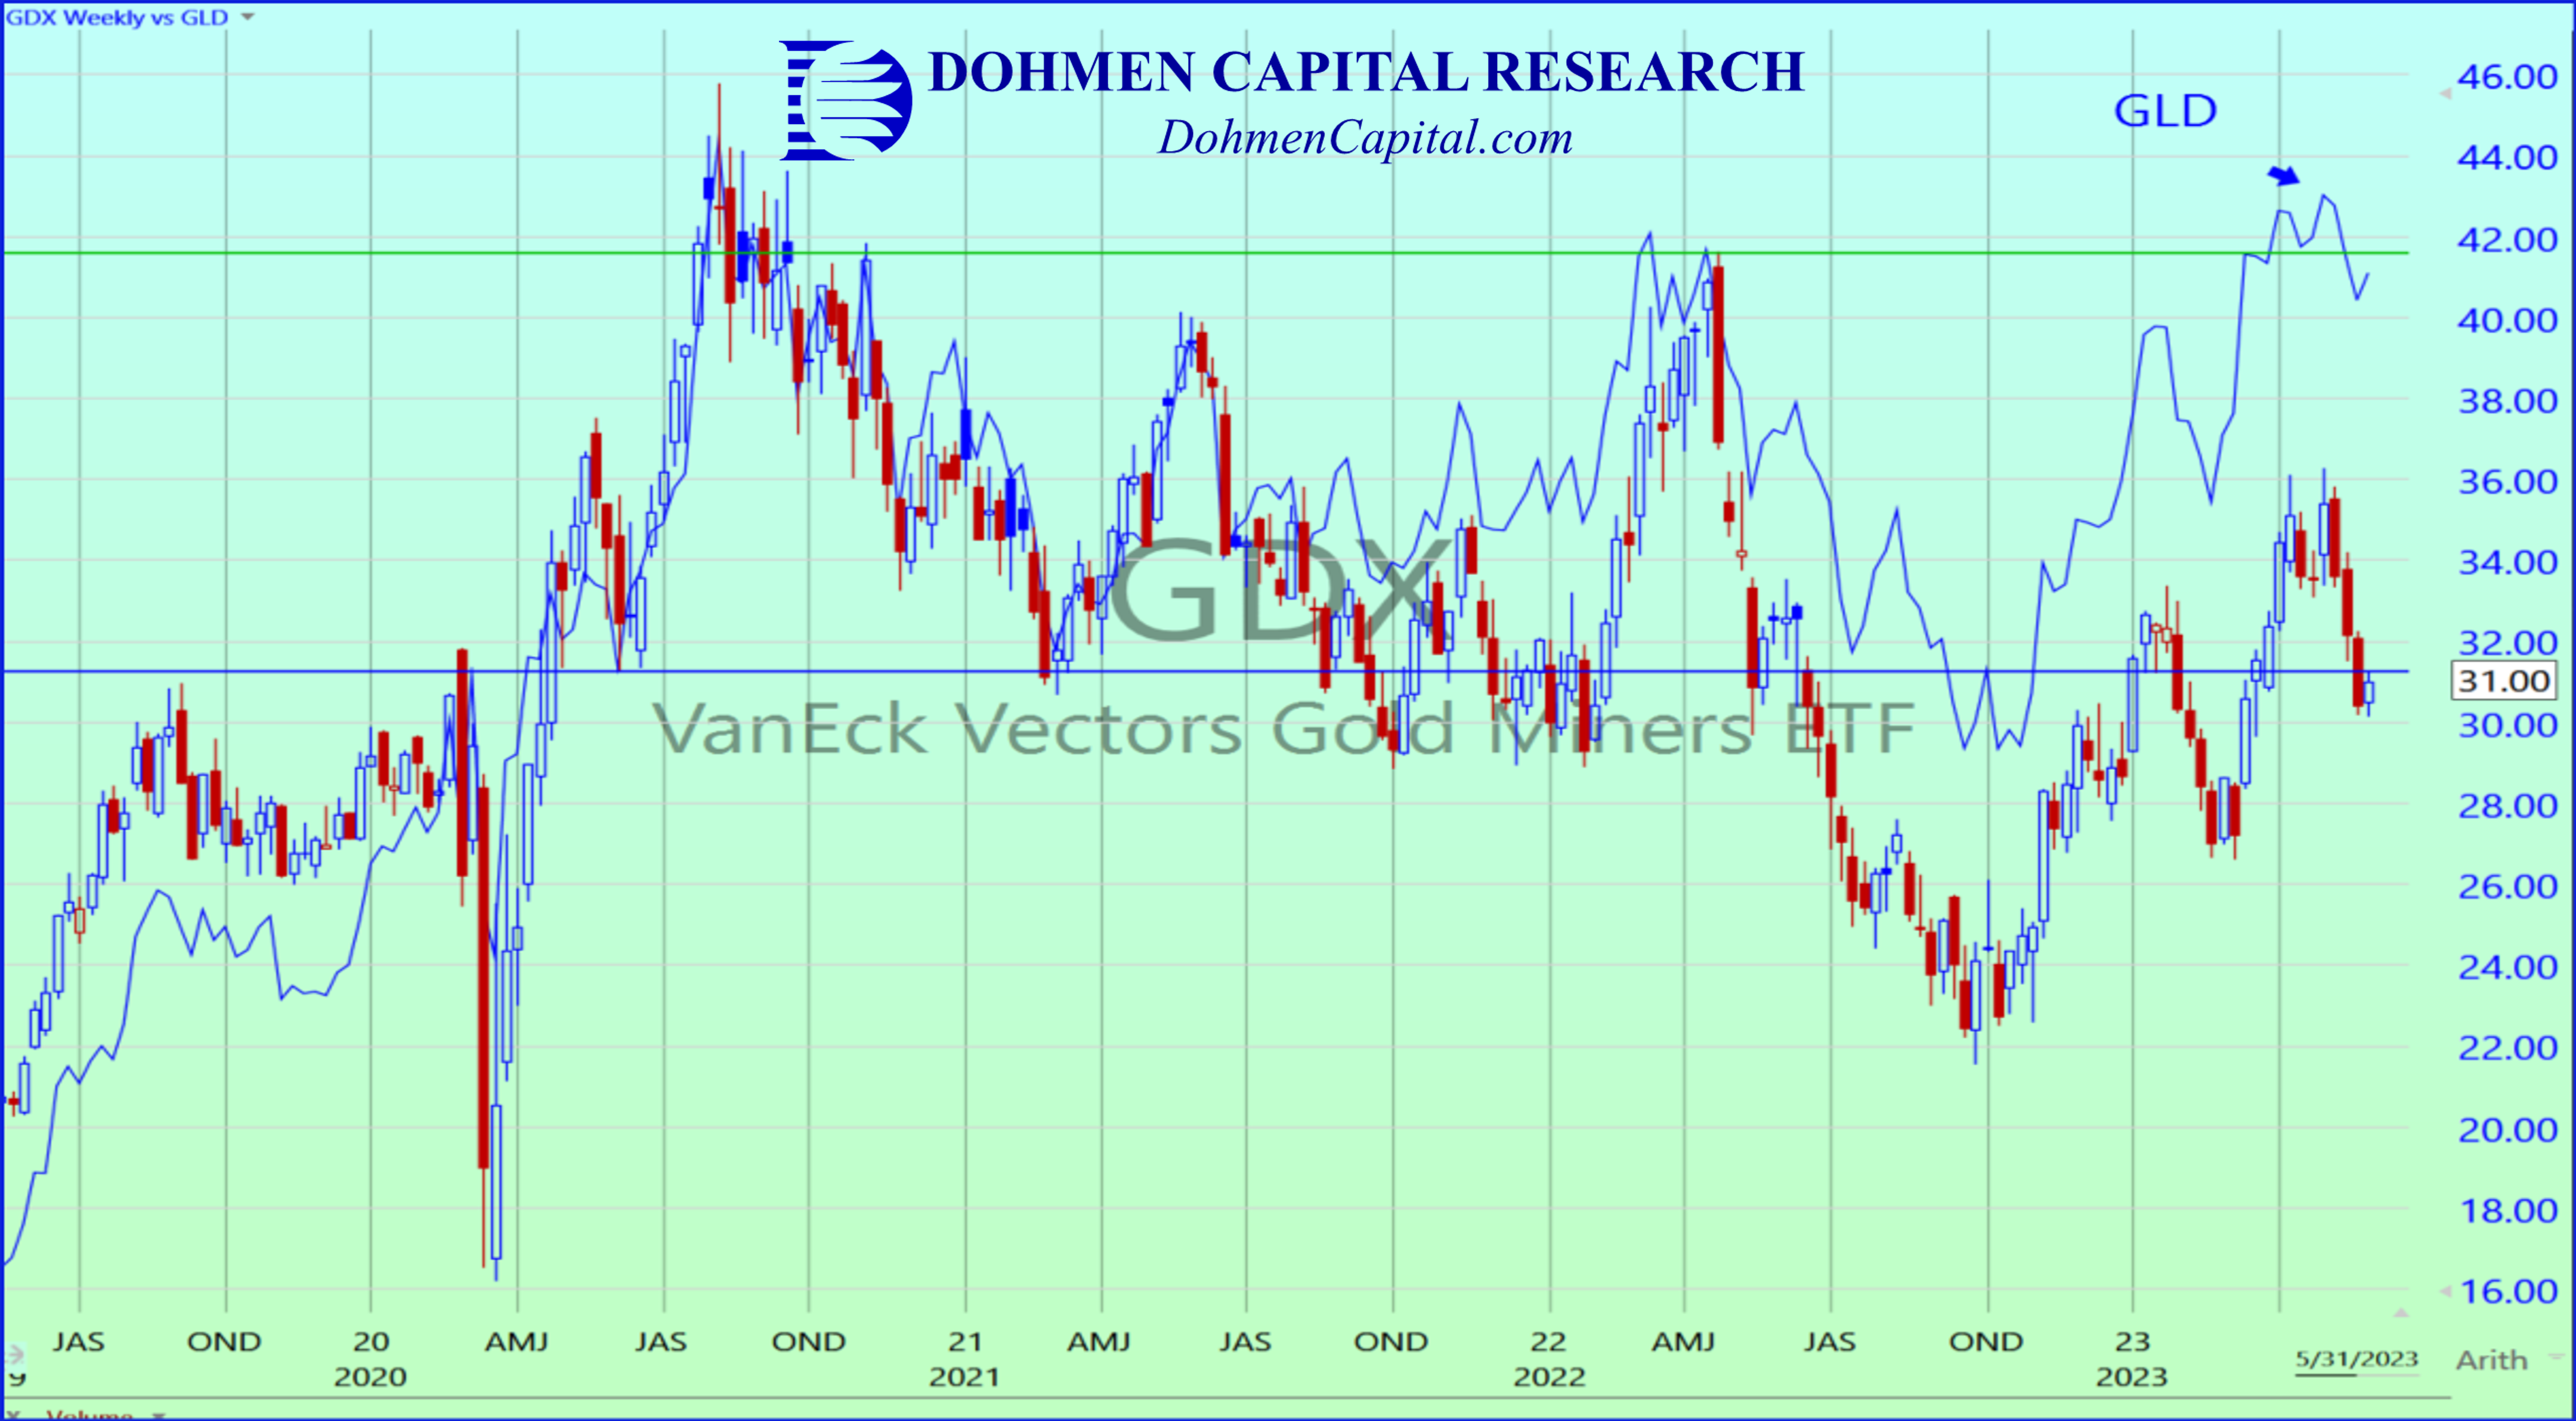
The recent $150 correction in gold impacted the gold miners far more severely as the chart shows.
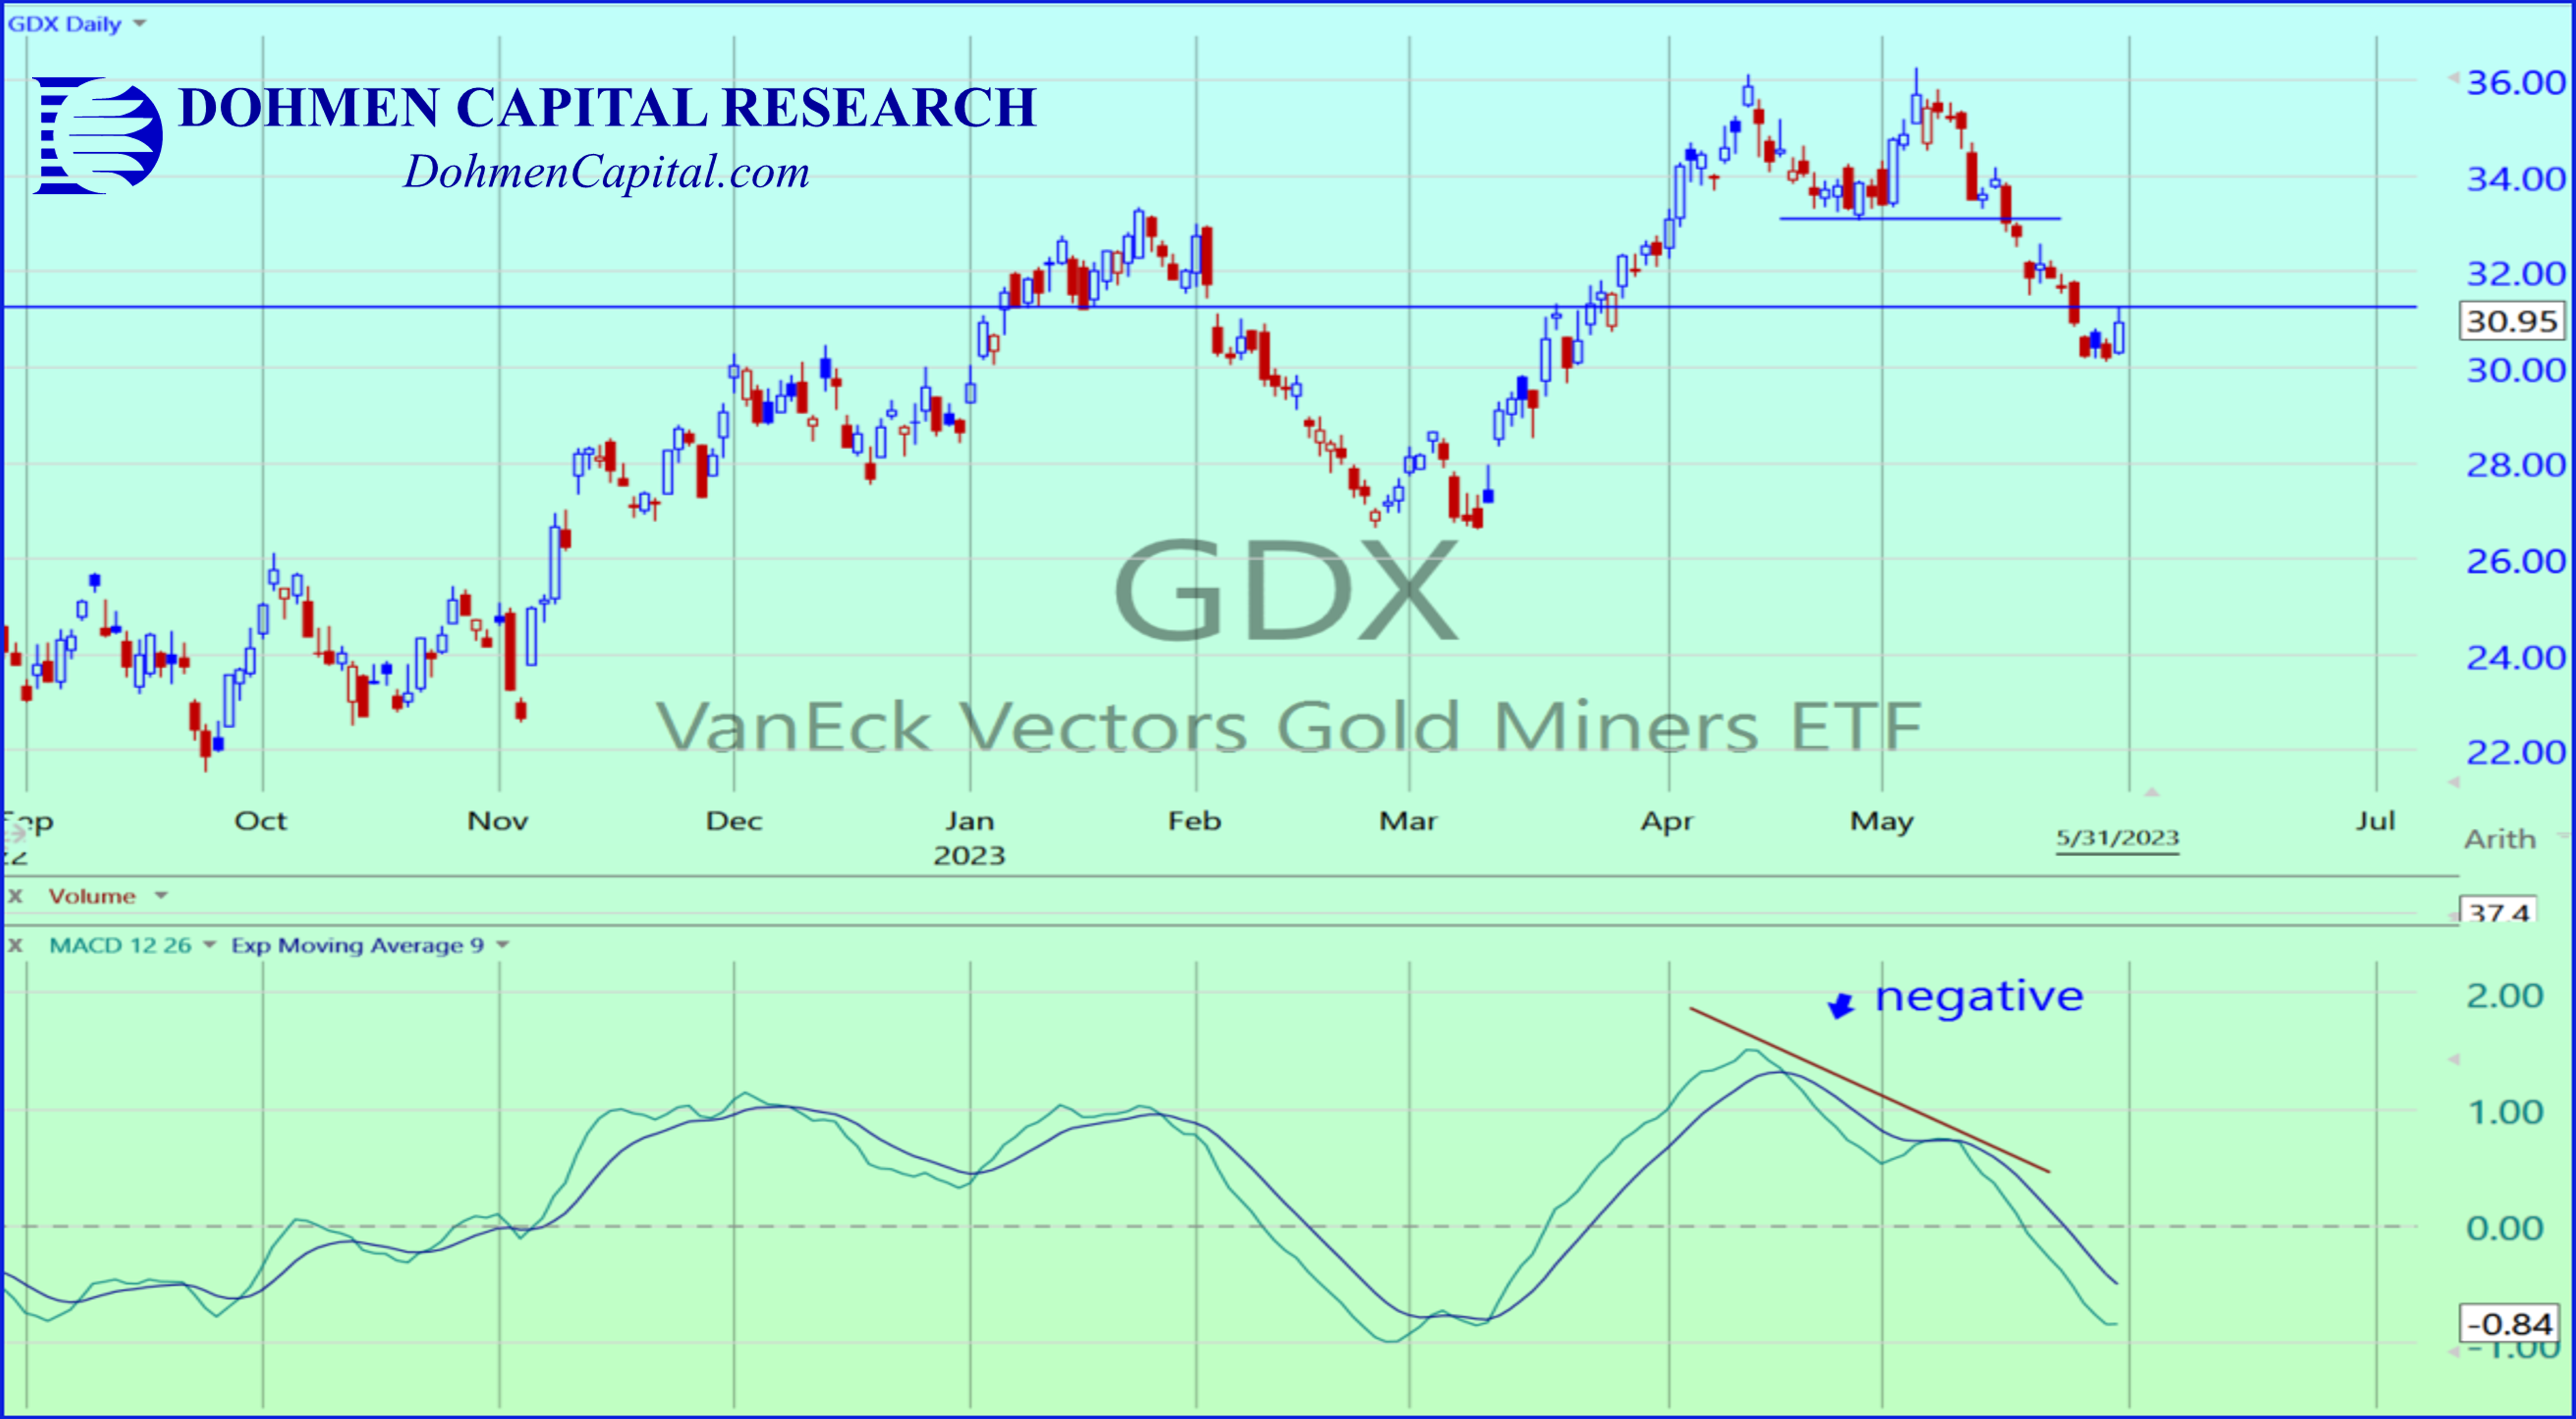
Below is the GDX (daily) with our proprietary Dohmen Money Flow indicator at the bottom. It is on a “sell” although it looks like it wants to bottom sometime the over next month.
CREDIT CONTRACTION & GOLD: A historic strong credit crunch will produce a historic economic contraction. It will hit all sectors of the markets, including Gold and all the metals.
Nothing is immune to a credit contraction, and temporarily not even gold. Everything will be sold to get cash, the one thing very few banks, companies, or individuals have.
Eventually, central banks and the politicians panic. A potential financial apocalypse is not desirable. The central banks like the Fed will create a new record amount of money and credit in order to stop the economic contraction. That should be the time to pick up gold, if the law permits.
On a recent interview with Daniela Cambone, I said that a decline in gold could be around 10% or $200 (watch that full interview here: https://bit.ly/BDInterview51123). That “correction” might eventually be a great buying opportunity if the Fed does what we assume, i.e. step on the accelerator hard when very bad economic numbers are released.
For now, the positions in gold futures have “Large Specs” net long 42% of open interest. That is the highest since mid-April 2022, which at the time was followed by a 20% plunge. A correction now may see a smaller percentage decline.
CONCLUSION: Whenever the majority turns bullish, as was the case recently with gold, it is smart to do the opposite. Advanced technical analysis is indispensable in doing this. Later, when the early bulls are dumping, we want to do the buying, not as a friendly gesture, but to pick up the bargains.
Remember something we wrote last year: over the long term, it is better to invest in the metals or ETFs of the metals rather than the miners, although in a “cyclical” bull market, mining stocks will outperform. But those gains are easily lost in the next big correction.
Wishing you successful investing,
Bert Dohmen, Founder
Dohmen Capital Research Group