
November was a spectacular month for the stock market. Bolstered by newfound vaccine optimism and the flow of stimulus from the world’s central banks, the S&P 500 closed on Monday with a more than 10% monthly gain, finishing its best month since April.
In general, however, it is always best to practice caution when the markets become too giddy. Readers of our latest award-winning Wellington Letter (published November 29th, 2020) knew about the bearish warning signs we saw late last week, ahead of Monday’s (November 30th) decline.
The major indices have soared over the past three weeks, with some breaking out to new record highs as we had expected in early November.
While we were able to capture some nice gains on the upside this month, a few of our warnings appear to be coming to fruition.
The two-day chart below of the S&P 500 shows why a pullback, perhaps sharp, could occur soon. Was Monday’s decline the start of it?
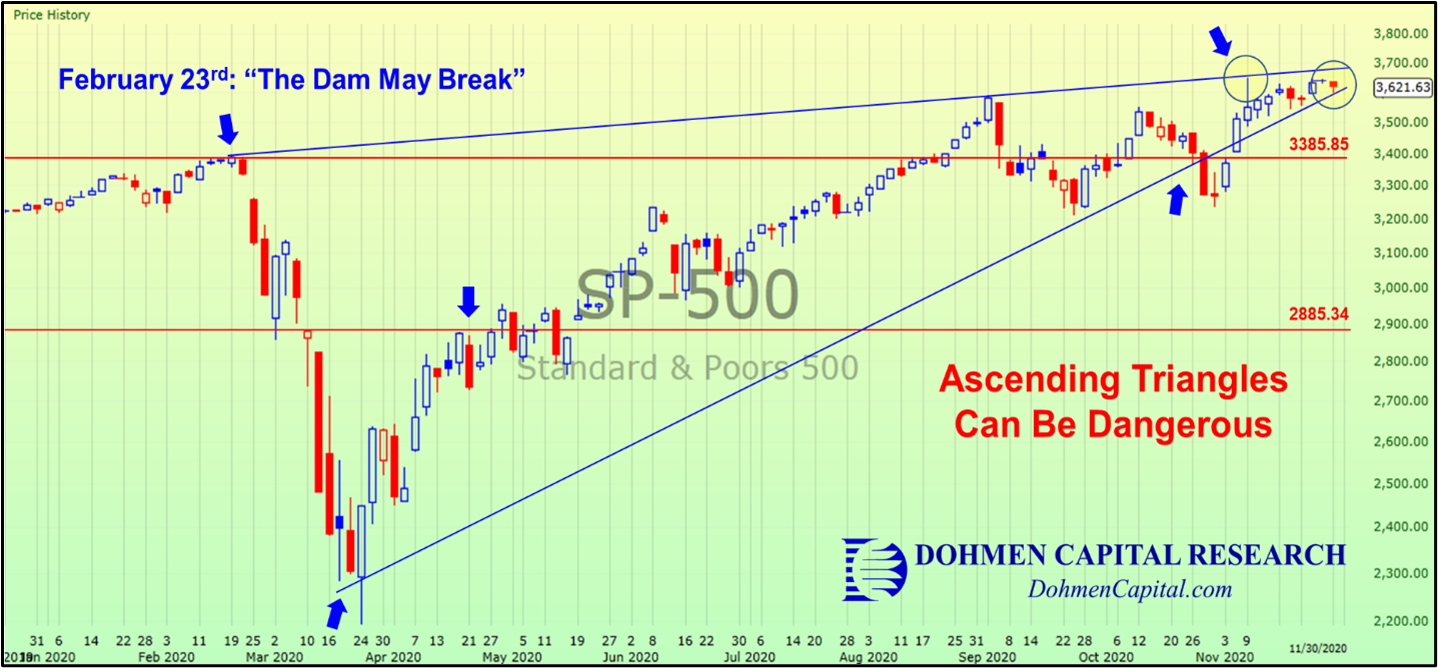
Take a look at the upper trendline of the S&P 500, which connects the February high with the September 1st high. That line should be resistance soon.
The November 9th high, followed by an intraday pullback, formed a negative candlestick. The top of that should also be a brief barrier now.
Furthermore, the VALUG Index, which we believe to be more important than the S&P 500 since it incorporates over 1600 stocks using an equal-weighting method, is now very close to its February high. It is not influenced by the disproportionate weighting of the mega-caps in the other widely watched indices. Below is its daily chart:
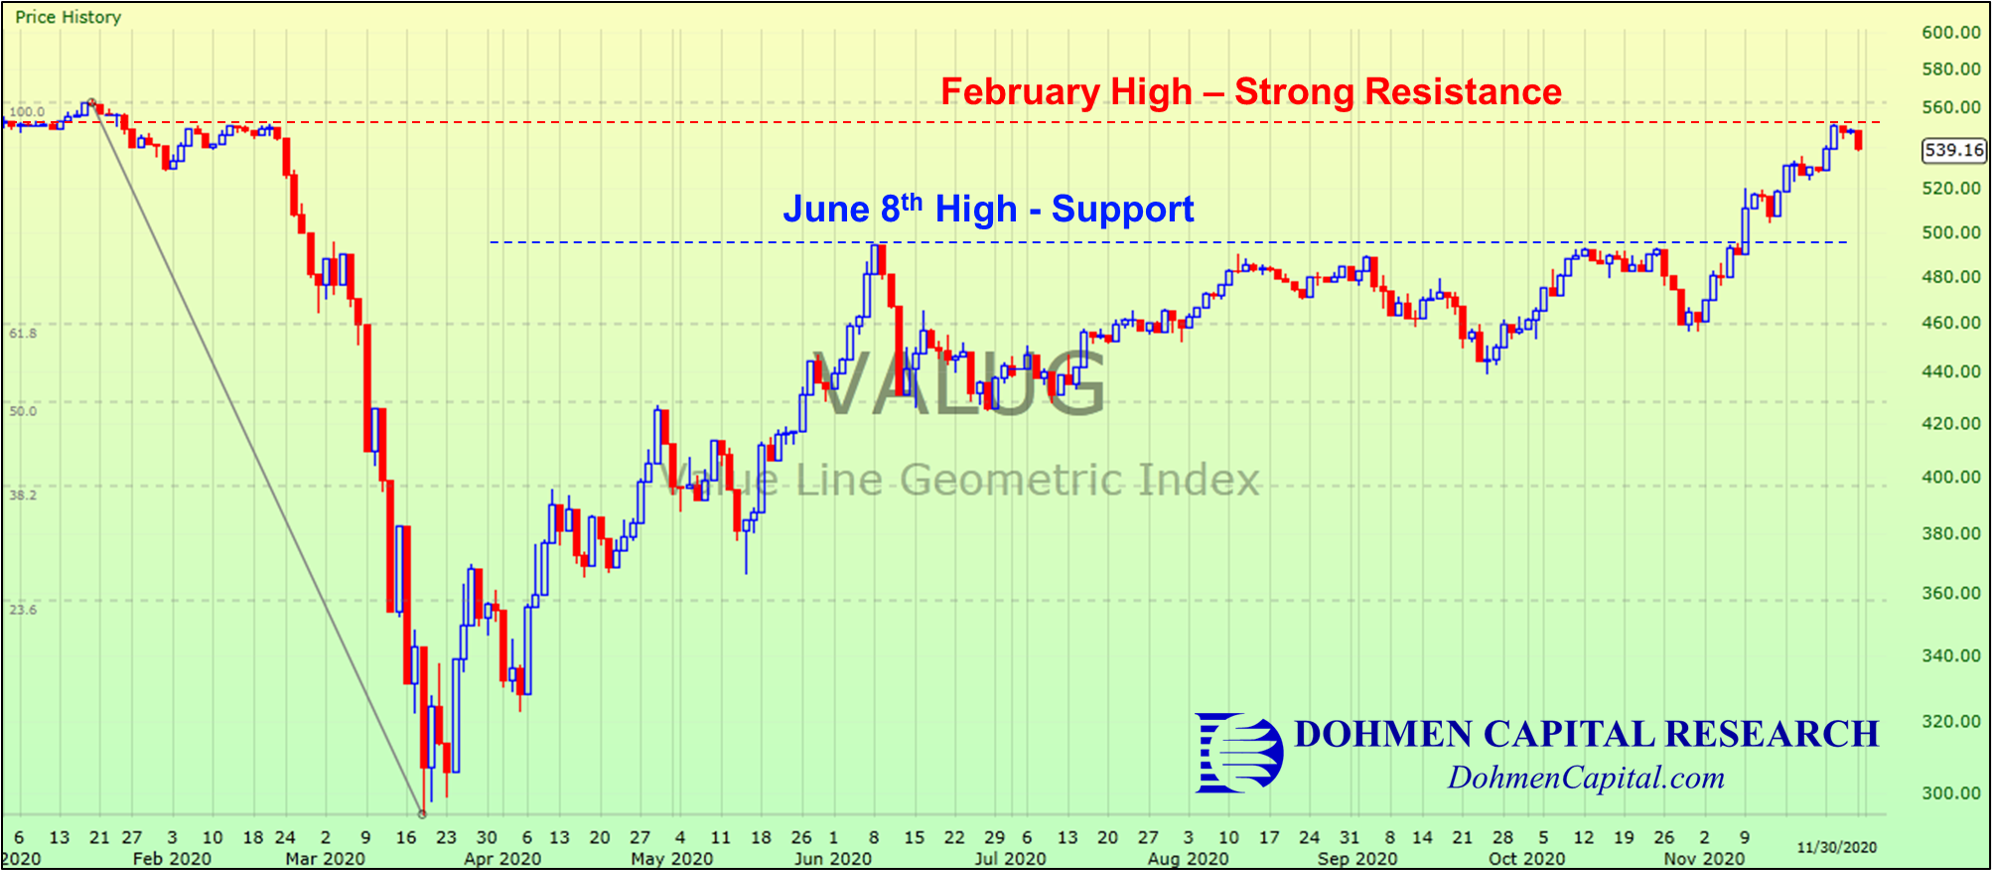
In early February, just prior to the market’s historic crash, we noticed a troubling divergence: the VALUG Index was making lower highs while the widely watched indices were on the rise. This bearish divergence, along with several others, clued us in that a big decline was on the way.
In fact, look again at the S&P 500 chart above to see how timely our “sell” signal was. We advised our valued members to sell and sell short in order to profit from the market plunge.
It is important to note that the market’s strength as of late has been much better than it was in February this year, with much better participation by the majority of stocks recently. However, the VALUG shows that even though we’ve seen great progress over the past few weeks, the majority of stocks still haven’t completely recovered their losses from the March crash (see top horizontal resistance line, i.e. the January 2020 high).
Several other indicators, sectors, and stocks are showing that markets have become excessively frothy.
The following monthly chart (each candle is one-month) shows the percentage of stocks trading above their 200-day moving averages. As you can see, this indicator had a huge rise in November. It is now approaching the extreme high level that occurred during the rally off the 2009 bear market low. Additionally, the long-term trendline going back to the 2009 rally (red) has been broken to the upside.
As the chart shows, over 82% of stocks are now trading above their 200-day moving averages, the most on record since February 2011. Note, however, that this figure increased by more than 30% in just the last month alone, a sign that the market is getting overbought. In the past, when this indicator has reached these levels, sharp pullbacks ensued shortly after.
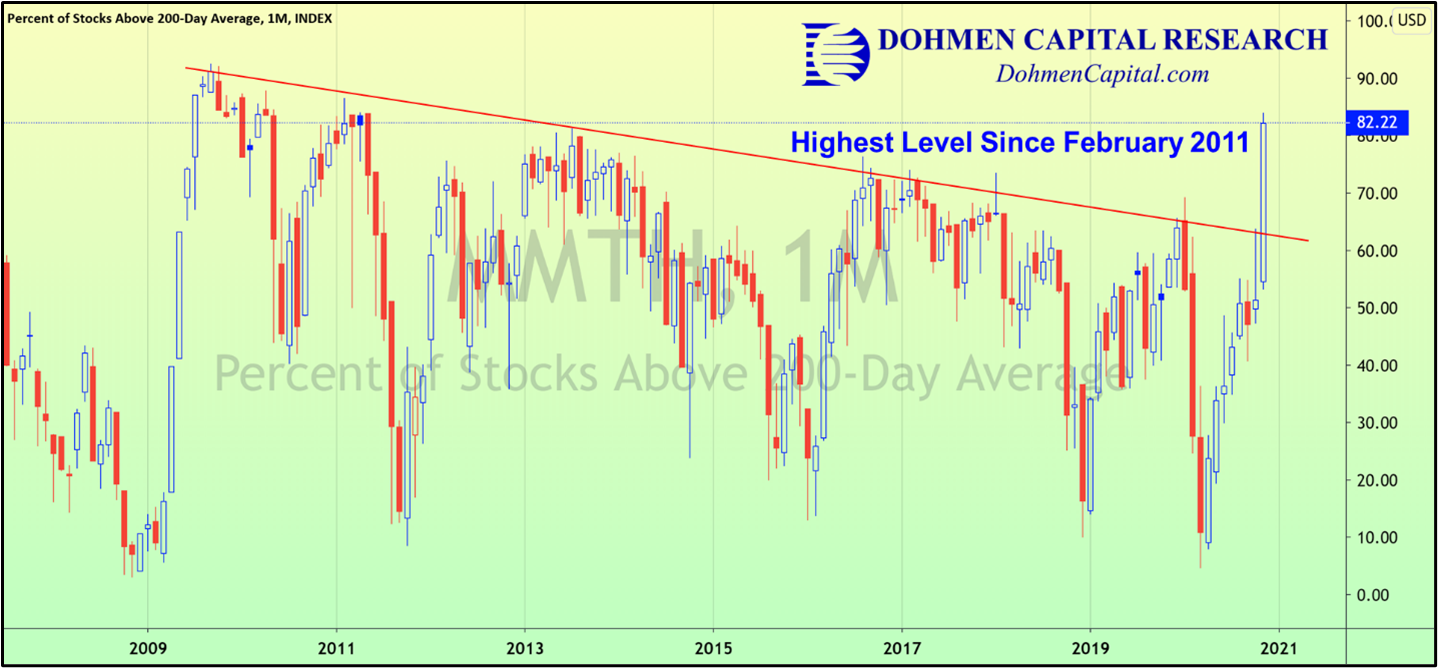
This shows broad market strength but also excessive enthusiasm. Signs like the above are warnings, at least over the shorter term. As we warned to our valued clients, “don’t be complacent.”
For most of the summer, the market’s indisputable leaders were the mega-cap FAANGs and other large-cap growth stocks. These stocks were seeing unprecedented gains, rising to new all-time highs and pulling the major indices up with them, boosting the speculative juices of investors.
Over the past month, however, the picture has dramatically changed. Now, the most beaten-down stocks this year are surging higher, closing the gap that formed over the summer, showing a significant rotation is underway.
The chart below shows the relative performance of the IWN ETF, which includes small cap value stocks, to the S&P 500.
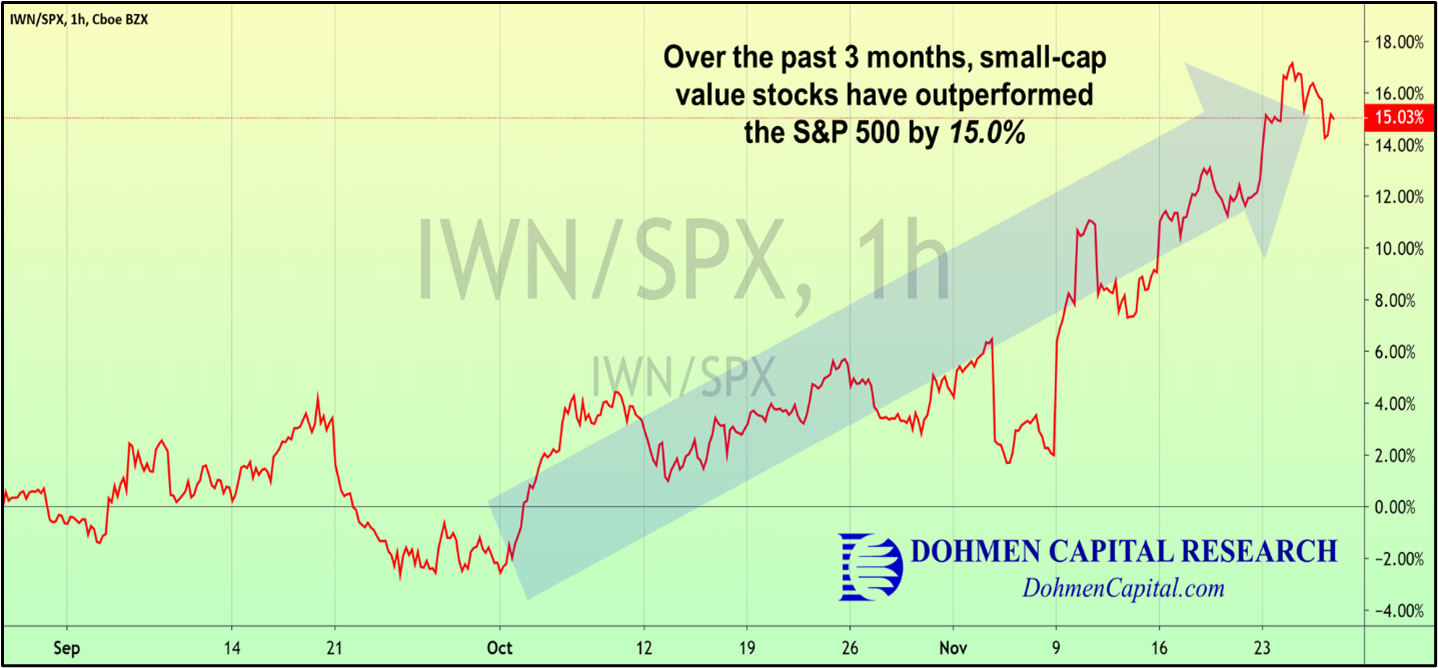
Yet, there remains the big question: while these smaller value stocks have performed well since October, will they continue to outperform into year-end and into 2021?
Any unexpected developments on the political front, delays in vaccine rollout, or other factors could emerge, changing the outlook. That is why we take an active approach to our trading and investing strategy.
To succeed in the markets, however, requires high-quality research and insights, along with the ability to question the prevailing sentiment in the markets and “go against the grain” when the time comes.
At Dohmen Capital Research, we have been providing these insights to our members for over 44 years, helping them profit through both bull and bear markets.
You can gain the edge in the markets you’ve been looking for with our investing and trading services, now offered at our lowest rates of the year for Cyber Monday: https://bit.ly/DCCM2020
These offers are only available for a limited time, so don’t delay. We invite you to join the winning minority today!
Wishing you good health and prosperous investing,

Bert Dohmen, Founder
Dohmen Capital Research
Dohmen Strategies, LLC