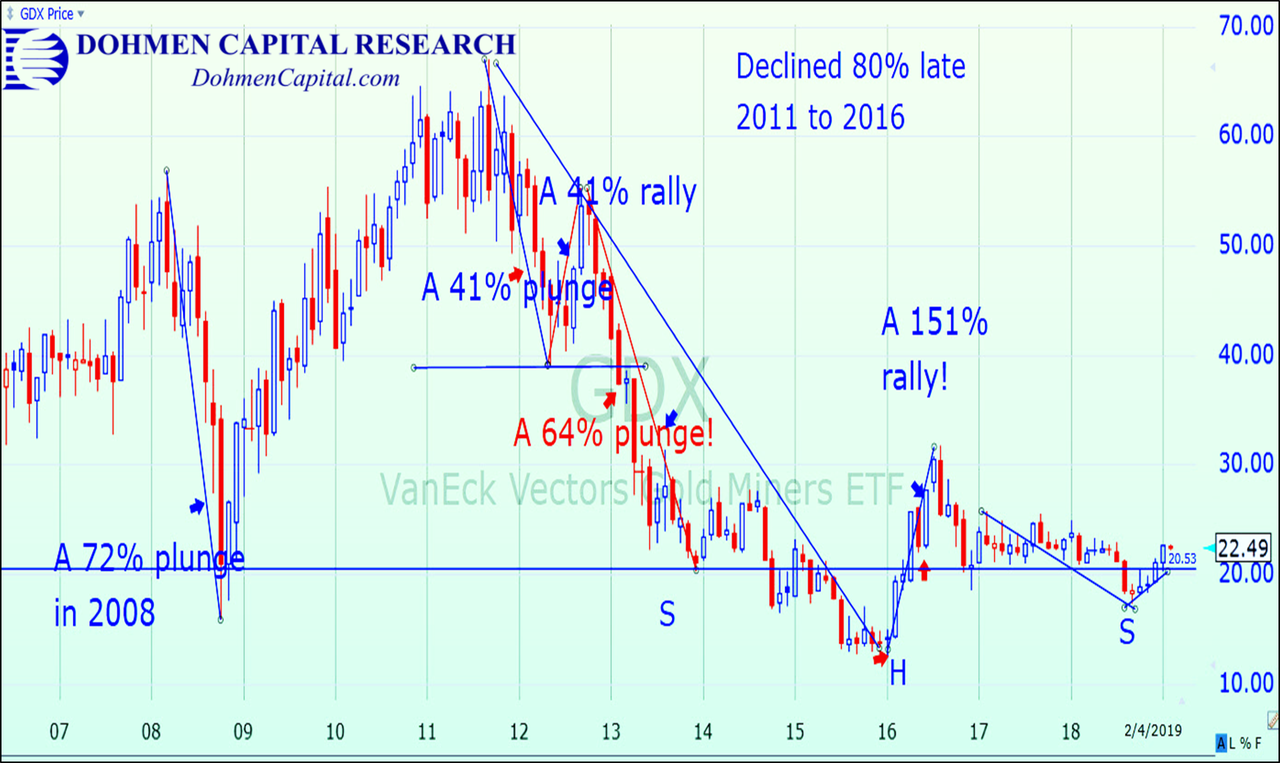
Investor interest in gold has dropped since the peak in 2011, when gold was around $1930/oz, along with the price. The low of that correction into 2015 was around $1045. It was brutal, with many gold mining stocks plunging 70% to 90% during the plunge.
We want to point this out before we present the positive factors we see at this time. But we also emphasize what we have said at Dohmen Capital Research for over 40 years: gold is highly manipulated by the big bullion banks.
Therefore, fundamentals are not always what determine the price. Significant losses can be accrued by even the smartest investors if they are overextended in this sector.
With long-term bullish sentiment on the precious metals so low until late 2018, and the gold price in terms of many foreign currencies already near or at new record highs, it’s only a matter of time before the U.S. dollar price of gold shoots upward. Although the very short term may see more of a pullback, the long-term factors are very constructive.
Our Longer-Term Analysis On Gold
The bottom in the precious metals has been forming since early 2016. As you can see from the chart of the ETF for the gold miners, GDX, it had a quick rally that year and then went into another sideways pattern until January 2019. Now the chart appears to be getting ready for a stronger up-move.
You can see that a long, bullish potential inverse “head and shoulder” pattern has formed.
A breakout in the near future would mean that the early 2016 low was a false downside breakout on a major (longer-term) scale. Such breakouts usually have very strong moves in the opposite direction, in this case upward.
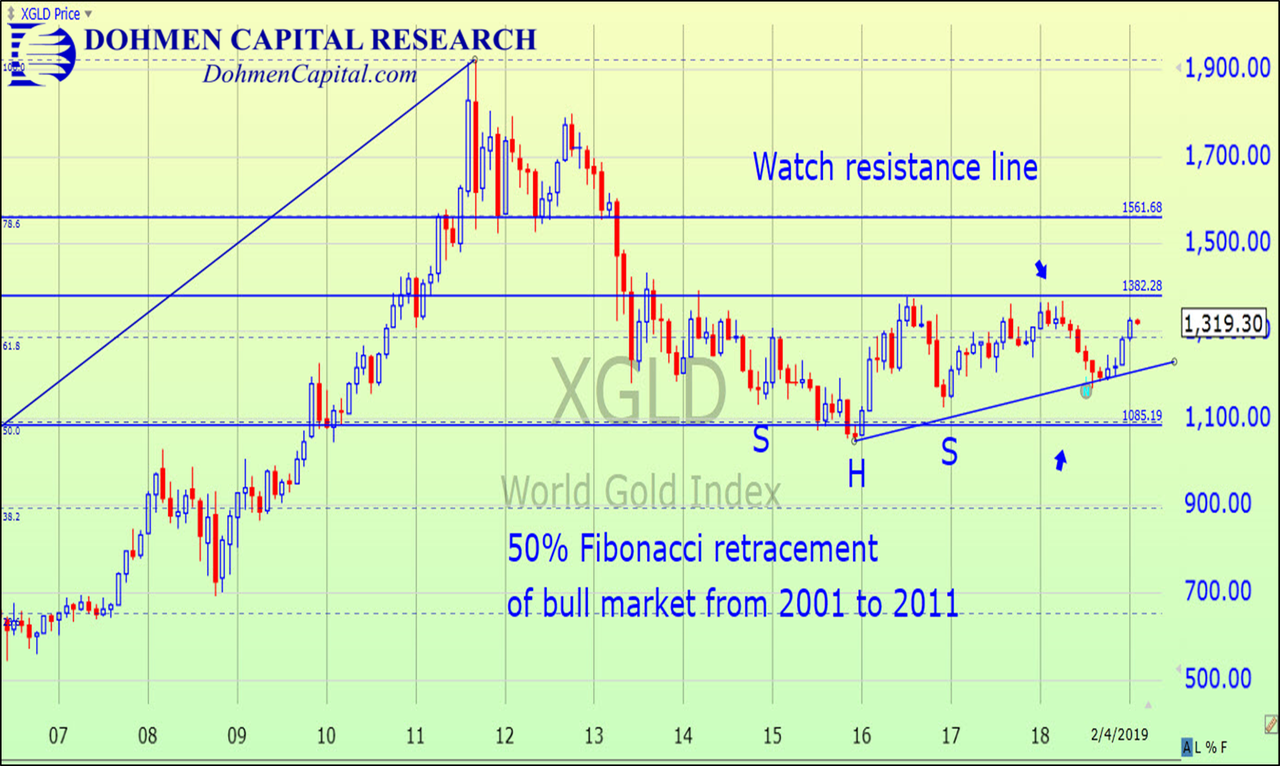
The chart below of the Gold bullion price (monthly) is bullish. The bottom of the “cup” has been forming since early 2016.
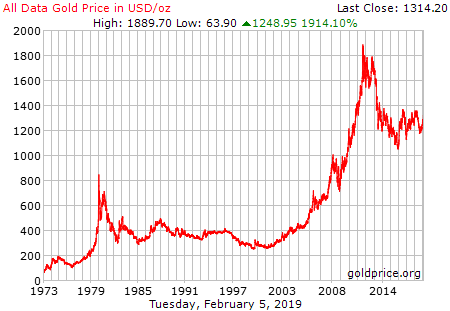
Look at the long-term (monthly) of gold bullion since the year 2000. It had a huge rise from around $250 to over $1930 in 2011. That was followed by a substantial 50% correction starting in 2012. A 50% correction in a major bull market is not unusual.
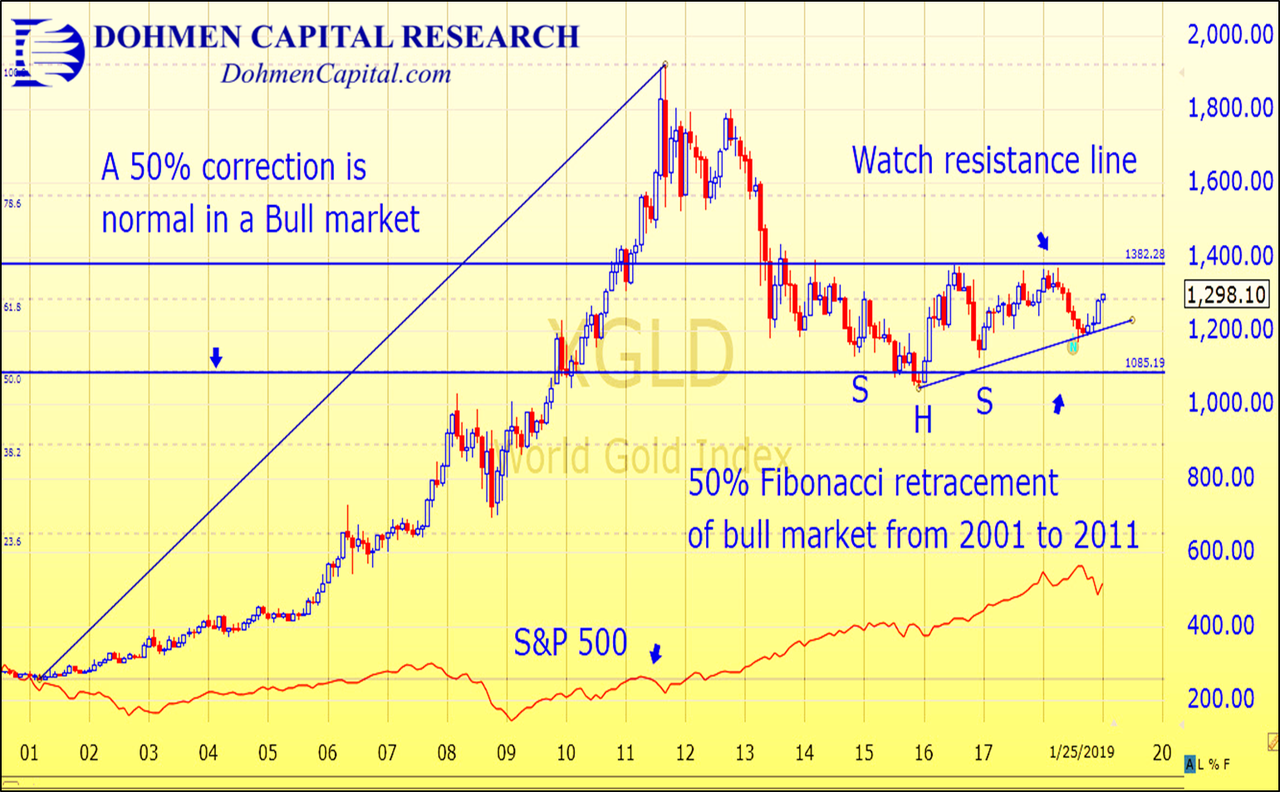
Even more important, the chart below (since 2007) strongly suggests that the low in gold in the year 2015 was the bottom of the ‘correction,’ or cyclical bear market, from the top in 2011. That suggests that the next big up-move could challenge the old high, and eventually even break through. However, at this time that is not a forecast.
Long time clients of ours remember the gold market peak in late 1980. The price of gold had soared above $800 in 1980. Many analysts were forecasting a rise to $3000. We predicted a 20 year bear market in gold in our award-winning Wellington Letter in 1981 based on our cycle analysis. That was greeted with universal disbelief. But it happened!
As we now know, the bear market lasted until 2001, exactly 20 years, just as we had forecasted in 1981. Usually, cycles are not that precise (see the chart below).
Just as important: The second part of our forecast in 1981 said that according to our very long term cycle study, that bear market would be followed by a 30 year rise in gold. We even said we had no idea what would cause it, but the cycles said it should happen.
If our remarkable forecast made in the year 1981 still holds true, Gold could have a continued secular bull market until 2030. That means the gold bull market could have about 11 more years to go. Historically the final phase of a bull market is the most spectacular.
Of course, cycles can shift to the right or the left, but the bear market cycle was right on target.
While some major indices approach record highs once again, serious investors are skeptical as to how they should invest their money now.
If the markets run into resistance at their old highs, will you be prepared for the ensuing downturn? Is your portfolio protected and diversified enough to save yourself from devastating losses? Perhaps you should taking a closer look at gold.
Complementary Report On Gold
Many investors now wonder, “is it still a good time to get into Gold and Gold stocks? Will another market correction be bullish or bearish for gold? And what has caused Gold to rise since mid-August 2018?”
We examine these vital questions in our new special research report on gold, “Why Gold Could Rise for the Next 10 Years.” It’s an incredibly important topic right now, which is why we dedicated 23 pages of our latest independent research and analysis on Gold.
We explain how investors should use Gold in their own portfolios, the factors and indicators impacting Gold’s latest move, current investor sentiment, how currencies have affected Gold, and of course the Fed and their recent policies.
In our latest report, we not only offer our near-term and longer-term forecasts but also reveal the evidence showing the key trends, technical signals, and clues on a number of important charts.
Get your free report on gold today!
Wishing you good health and prosperous investing,

Bert Dohmen, Founder
Dohmen Capital Research
Dohmen Strategies, LLC