
Markets Suffer Big Losses Since the Start of August…But is the Selling Just Getting Started?
Stocks have sold off over the first two weeks of August.
At first the selling was hidden in the lesser looked at indices like the NYSE Composite and Russell 2000. But then it spread to the highly promoted ones like the DJI and S&P 500.
After a bit of a relief rally on Friday (August 18th), traders are asking themselves,
“Is now the time to jump back into the markets and buy?
Or is this simply a pause before another big onslaught of selling?”
Here’s an important chart we showed our valued members on August 17th, pointing out revealing clues we’re seeing now so they can prepare for the next short-term move.
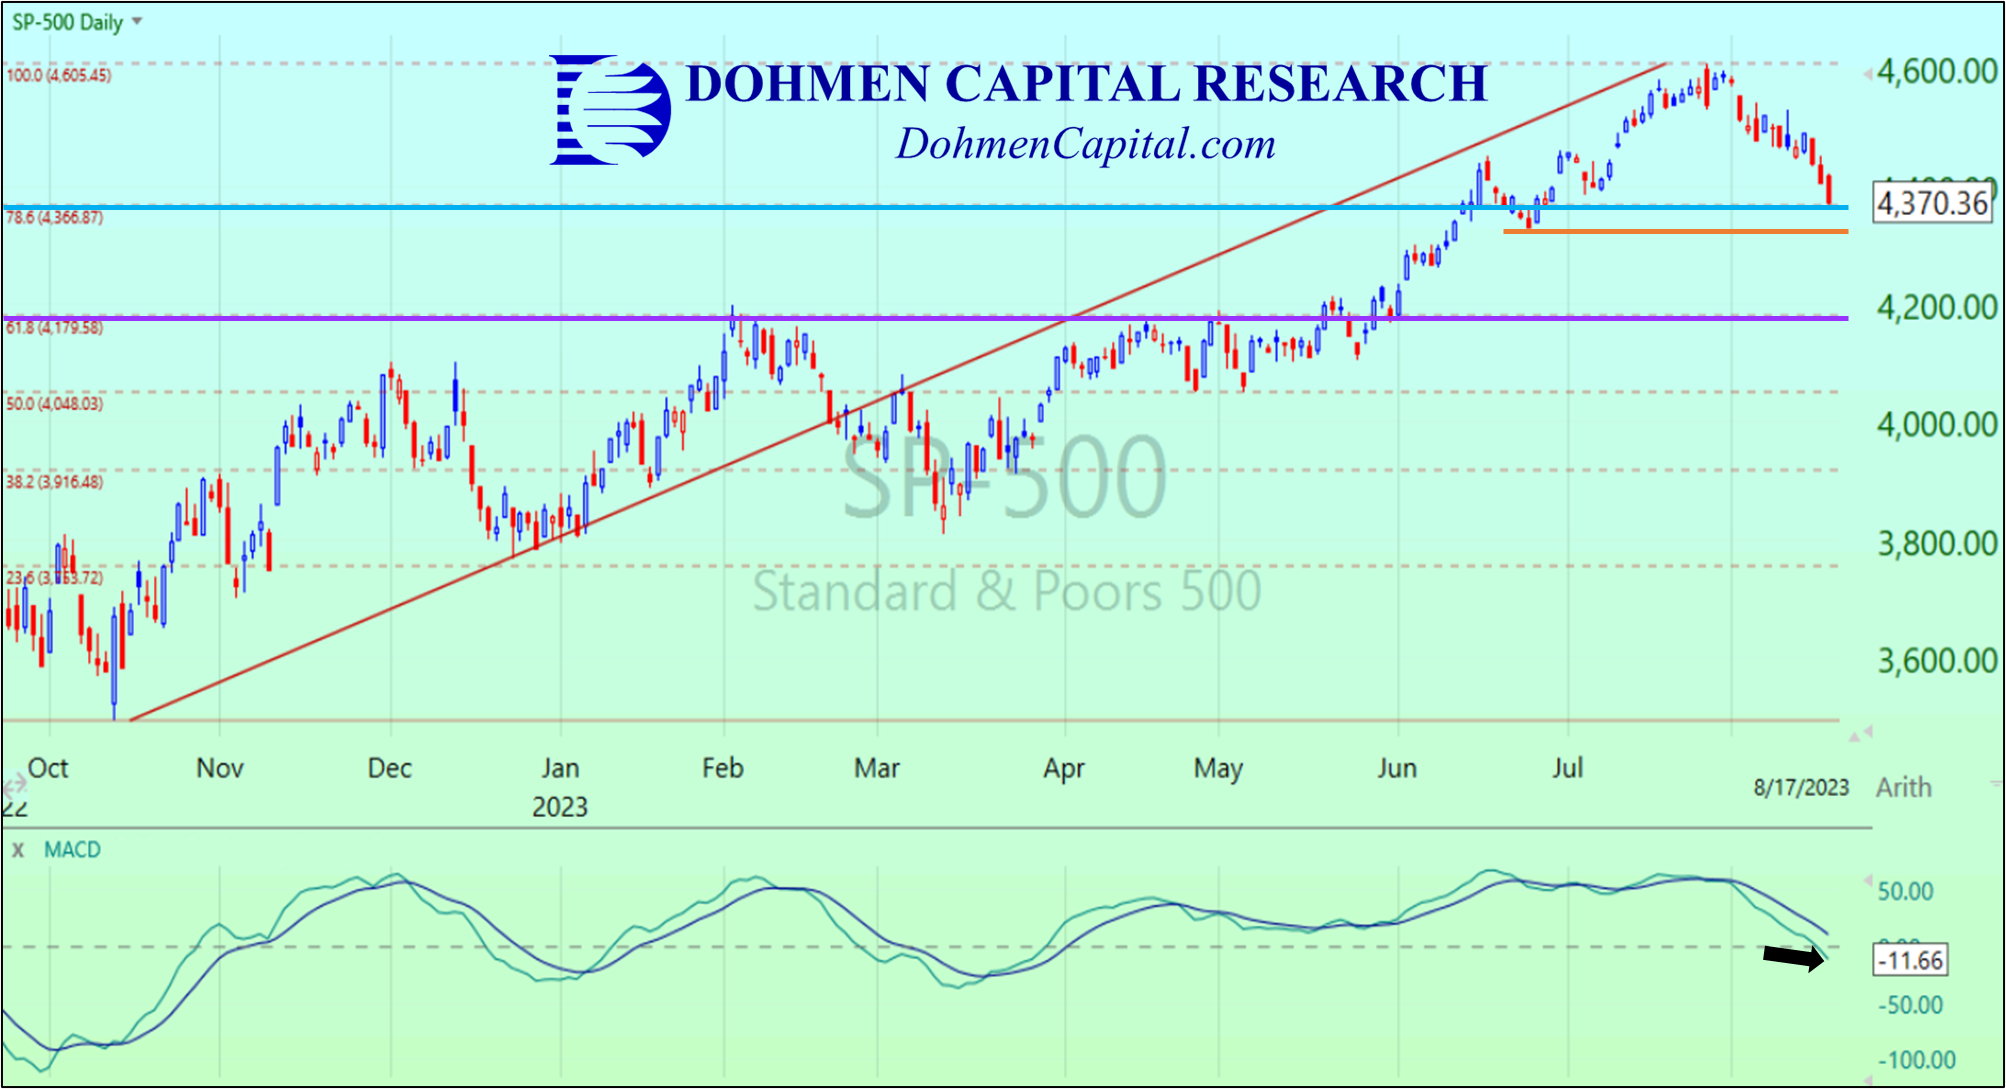
As you know, August has been a terrible month for the bulls who believed the “new bull market” narrative that was being promoted all over the financial media.
However, we’ve been warning about a near-term top of the rally to our readers since August 1st!
Our members were prepared for the rally top and the “silent” plunge since then, which we forecasted in our August 1st Smarter Stock Trader. Here’s an excerpt from that issue:
The Smarter Stock Trader
August 1, 2023 Issue
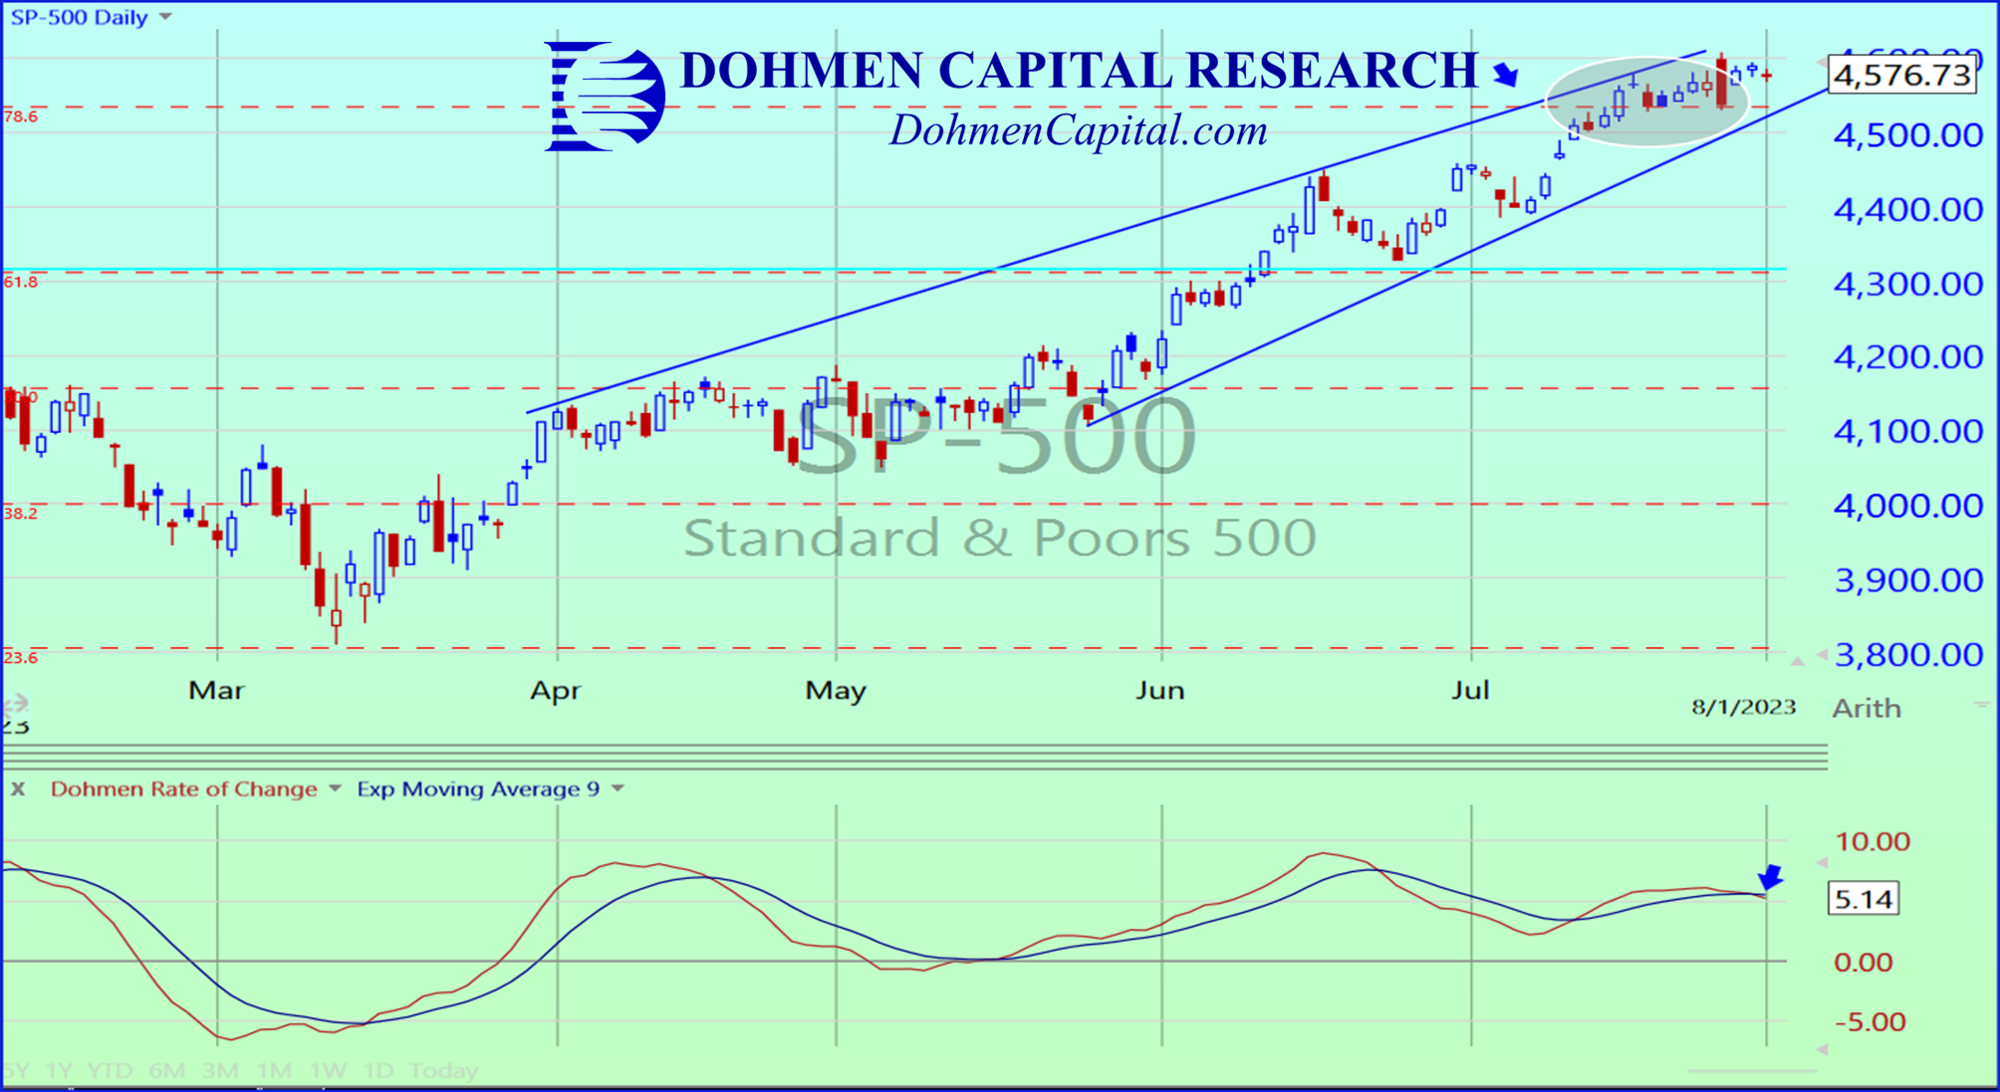
“Here is the daily chart of the S&P 500. The chart has a wedge formation, which is getting negative. At the bottom is our Dohmen Rate of Change (DROC) indicator, which is now in the process of giving a “sell” signal. (chart as of August 1, 2023)
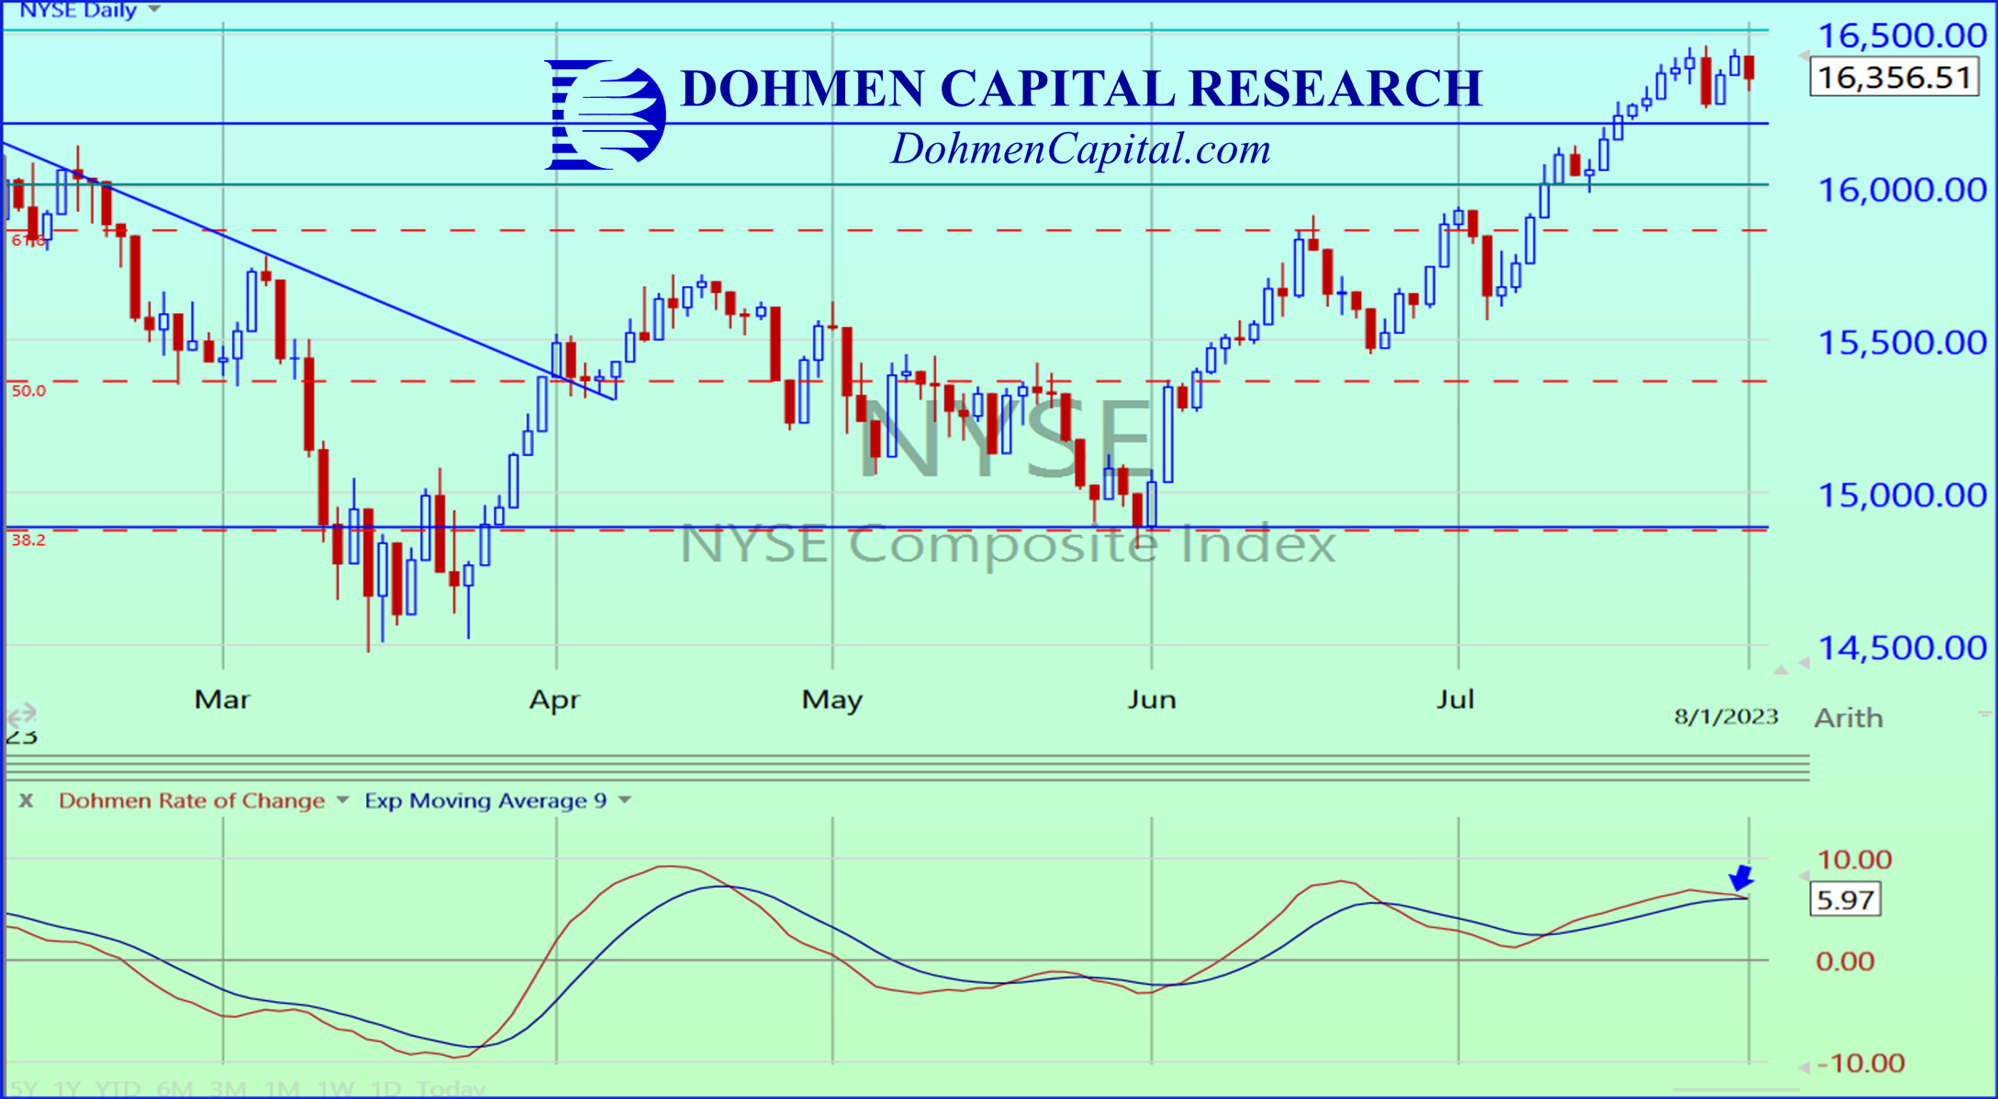
Below is the daily chart of the NYSE Composite, which is broader and more reliable as a gauge of the market than the S&P 500. It closed today just under a very important resistance area marked by the green horizontal line (near top). The Dohmen Rate of Change at the bottom is now crossing over for a sell. (chart as of August 1, 2023)
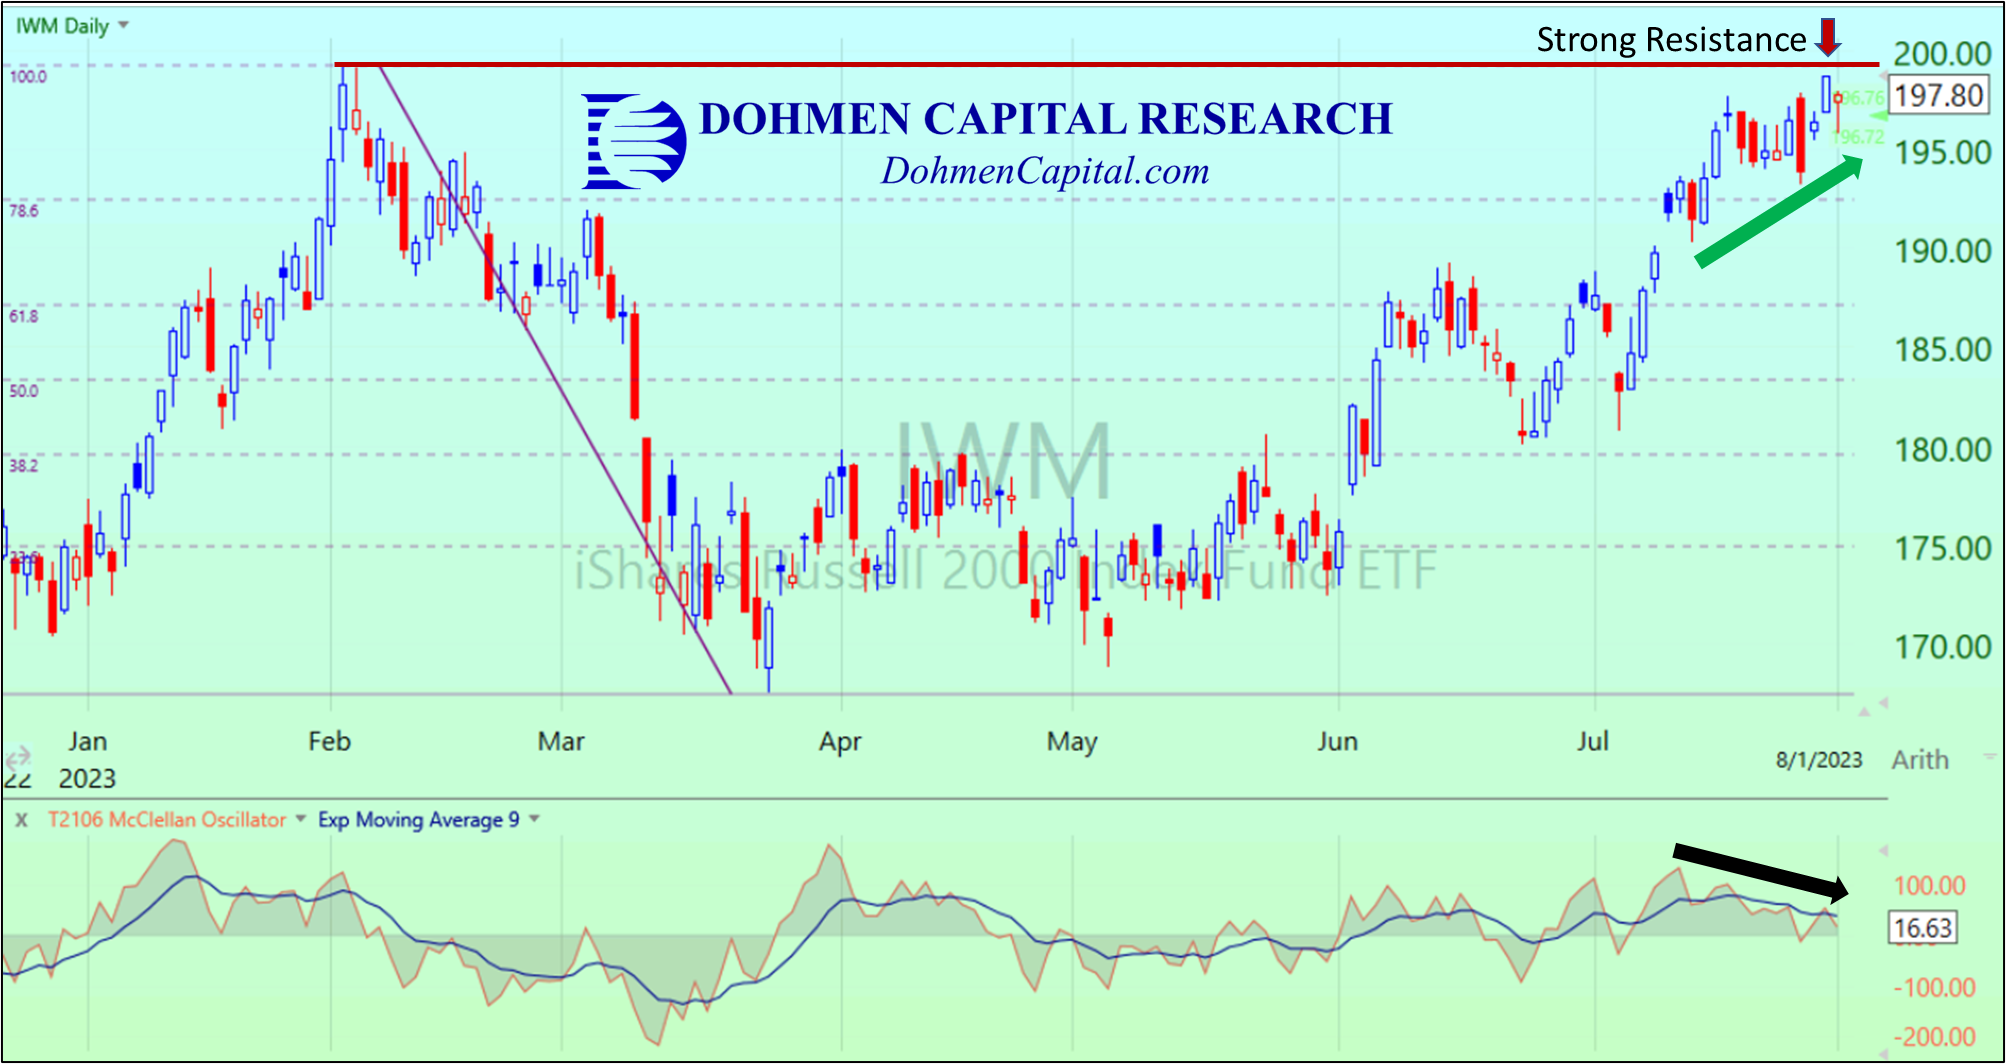
The daily chart below shows the IWM (Russell 2000 ETF) is approaching strong resistance from its February highs (red horizontal line).
Notice the McClellan Oscillator (a breadth indicator, bottom) has been declining since mid July (black arrow), which means more stocks in the IWM have been selling off. Meanwhile the IWM has been rising in price (green arrow), giving a bearish divergence and a warning of a decline ahead.“ (chart as of August 1, 2023)
(End of excerpt)
Once again our prescient analysis called another important turn right on the button as the markets started their decline the next trading day on August 2nd.
In fact, since that call, the S&P fell nearly 6%, the NYSE Comp dropped nearly 5%, and the IWM fell over 8% to their recent lows.
Yet bigger losses were seen in some of the most widely traded stocks out there (through their Friday lows):
Tesla = -20.3%
Meta = -15.0%
Apple = -12.6%
Nvidia = -11.2%
Netflix = -10.3%
How much wealth could you have saved had you been a Smarter Stock Trader member a few weeks ago?
These timely calls are exactly what our Smarter Stock Trader members have become accustomed to over the past several decades.
This Shows Just How Valuable it Can Be to Have Access to Professional, Experienced, Consistent, and Insightful Research and Market Analysis.
Prescient forecasts are what we provide for our Smarter Stock Trader members throughout each trading week, always aiming to help them position their trading portfolios ahead of the big moves, up and down.
If you missed this latest critical turn, it is not too late to join “the winning minority” with our other happy members. The biggest market moves are still ahead as we enter the tumultuous Fall season before year-end.
Now is the time for you to prepare for the major market moves ahead in order save your valuable assets and profit from the market declines.
Over the past 45 years, Bert and our team has consistently forecasted important market moves like the August 1st turn we discussed above, saving our valued members from devastating losses.
There is still time to protect your wealth and take advantage of opportunities in the current market environment, especially with the volatile Fall season approaching in September.
With some indices already down over 24% from their 2021 highs, our Smarter Stock Trader members were prepared for the big declines and had great opportunities amid the turmoil.
Our Theory of Liquidity & Credit, developed by Bert in 1977, has enabled us to predict the important market moves, saving our valued members from devastating losses and earn great profits.
Sign up today and you can gain access to most up-to-date shorter-term analysis of the markets, allowing you to prepare your trading portfolio right now ahead of the next major market trend.
With the Smarter Stock Trader, you will receive 1-3 issues per week of in-depth research, analysis, and insights from Bert Dohmen, ranked #1 Market Timer by Timer’s Digest. Now, you too and can learn how to trade like a Pro!
In each issue, we provide our top stock ideas for the short-term as well as our market timing, suggesting when to get in and out of each position.
Many part-time traders have become full-time traders and now trade for a living. It beats rushing to and from the office each day in heavy traffic.
The knowledge and skills you can gain from our stock trading service, the Smarter Stock Trader, can benefit you for the rest of your life.
Don’t Wait – sign up today to gain instant access to our latest issues over the past two weeks!
Become A Smarter Stock Trader Today With This Exclusive Special Limited Time Offer:

*Special offer only available to new and non-active Smarter Stock Trader members until 11:59pm PST on August 21, 2023