The markets plunged for four consecutive weeks in the month of May. This hasn’t happened since late 2014.
Hopefully you listened to our warnings and were not overexposed as most investors were. We know that the vast majority of money managers got caught up in the bullish euphoria and once again were holding their positions the entire way down from the April-May top.
As usual, the majority of analysts advised to go bargain hunting during the plunge. During the next rally, that stock bought will become potential supply when it is sold.
Our advanced technical analysis says that the “buy the dip” strategy, which works during a bull market, will be treacherous this time. Looking from now to the 2020 election, the bulls should experience serious pain.
In our work, the most important market indices are in bear markets. That means danger for the bulls, but potentially excellent opportunities for those prepared for a bear market. Informed investors can focus on the few areas that do well in a bear market and sell the most vulnerable and overvalued sectors short.
At Dohmen Capital, we don’t fear bear markets. In fact, we welcome them, as stocks plunge faster than they rise. But only technical analysis can give you the confidence to sell short.
Big damage to well-known stocks has already occurred. Globally, over $5 TRILLION of wealth has already been wiped out during the past 6 weeks. This was no ordinary market pullback.
Yet, most investors were not prepared for the plunges in many key stocks since the recent May 1st top.
Most of the well-known companies that had IPO’s this year have performed very poorly. This is evidence for the lack of appetite by investors for vastly overvalued firms, many of which have no earnings.
Twenty years ago Wall Street never would have done such IPOs. Now they desperately need the business.
The vast majority of analysts and investors are usually blindsided by their optimism, as they were ahead of the market plunges in late January 2018 and September 2018.
In fact, after the September, the declines hit bear market proportions, i.e. 20% down from the tops.
Extreme optimism always occurs near an important top.
Beginning in mid-April we saw a number of our indicators and important charts flashing clear warning signals, similar to September last year ahead of the 3-month market massacre.
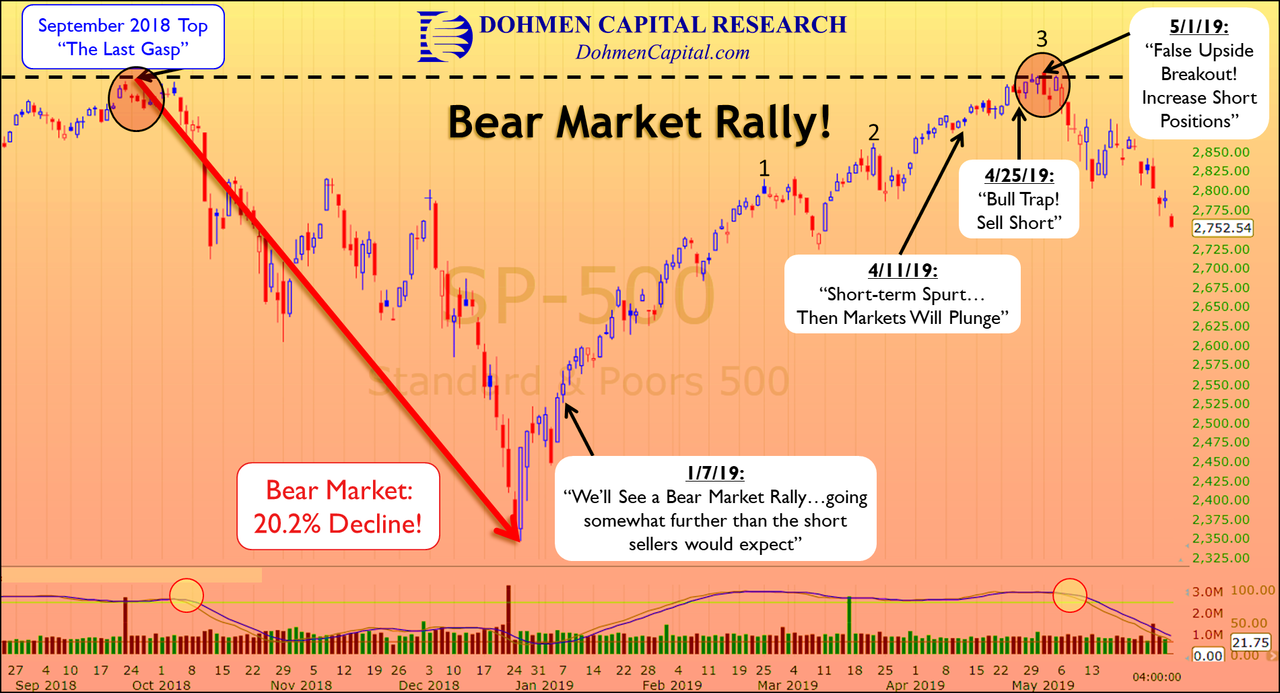
Most investors and analysts touted the rally since the late December low as a continuation of the bull market. However, we pointed out that it had all the signs of a bear market rally: volume continued to decline as prices rose.
That is an important indication that demand is declining as prices rise.
We even predicted early this year that some indices could make new highs in the rally while the broader, more important ones would not. That’s exactly what happened.
The 30 stocks in the Dow Jones Industrials are frequently manipulated upward to make a new high, thus giving the perception that the market is booming. The high-speed computers of high frequency trading can do that. It’s all “fake.”
You see, that’s where over four decades of experience in the financial markets count. You have to know where to look.
There were plenty of warnings, which I will explain here. These warning signals will provide a great lesson for serious investors.
If you remember these techniques, you will know more than perhaps 90% of the Wall Street guys you hear in the media.
On Thursday, April 11, we wrote:
Before a major bear market, there is often that last recovery attempt from the initial decline, but it lacks participation as can be seen by very low volume numbers.
That eventually leads to a “secondary top,” which can even be higher sometimes than the first top. But the internal indicators are much weaker.
In the 2007-2008 stock market top, the real market top was in July 2007 on some indices and mid-October on others. However, Fed interventions postponed the inevitable plunge until late summer 2008.
We wrote early this year that our most likely scenario would be a short-term rise followed by a market plunge, saying:
The stock market will have a short-term spurt to enable Wall Street to do the last“distribution” of stocks and launch the IPOs that are waiting before the next substantial bear market. Then, or before, the markets will plunge.
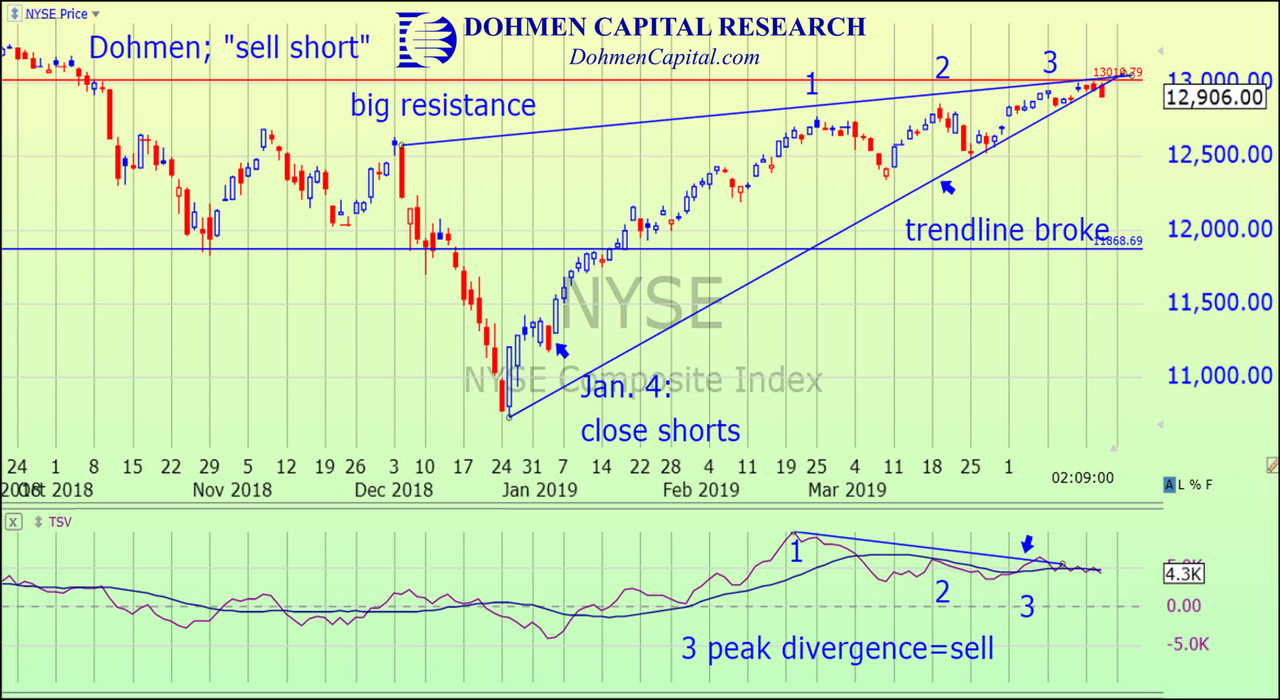
Over the next week, the divergences and bearish signals became more evident. On April 17 we wrote about the first sell signal we were seeing:
Our rule is that a top often makes 3 peaks. We use a variety of indicators. At the bottom of the chart is the TSV, which includes price and volume for a certain time period. Note that while the NYSE was rising higher, making three peaks, the TSV made two peaks lower than the first one.
Furthermore, we now have a bearish ‘rising wedge.’ Before HFT and algo-trading these were very reliable. The rule was that when the lower rising trend line was broken, there would be a sharp decline…Note that this trend line was broken today.
Then, just a few days later on April 23, the major indices were pushed above their recent highs, making some of the indices “break out” by a small margin.
We had expected one or several major indices, the widely watched ones, to make new record highs before a top is made, while other more important and less manipulated indices would not. On that day, we stated:
The NASDAQ 100 has already made a new closing high and the S&P 500 made a new closing high today by about 3 points.
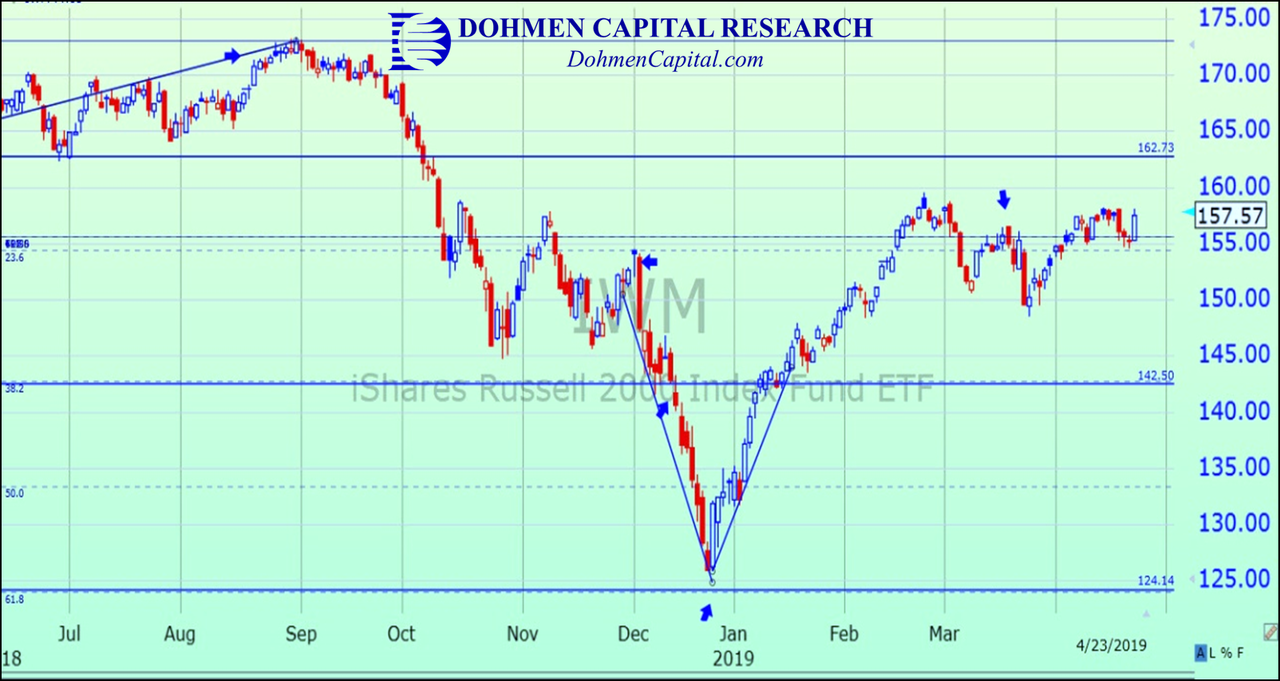
But the very broad Russell 2000 index is still 9% away from making a new high.That shows that the majority of stocks are lagging while a few big cap stocks are being manipulated upward.
That suggests the lifespan of this rally is closer to the end. Here is the chart (ETF for the Russell 2000 as of April 23):
We recommended a number of very timely short sale positions two days later on April 25 as we were noticing increasing signs of big selling over the previous few weeks.
All this was occurring while a couple of indices have rallied to new highs. These were important signs of a bull trap!
The top was finally made on May 1 on the S&P 500, but earlier on broader indices we prefer such as the VALUG.
We explained the major warning signals that were showing us a top had been made and reasons for our bearish view over the next month.
We recommended additional short-sale positions, which allowed our clients to profit nicely from the ensuing market declines.
On May 1, the major indices had remarkable reversals, from up to down by the close. We wrote:
The rampant bullishness of the guys on financial TV was remarkable again today…All the bullish talk we heard on TV early in the day was destroyed by the late-day decline.
We have seen this many times before over the last four decades. And it always ends badly for the bulls. When all these traders are positioned for breakouts, the eventual breakout comes to the downside, not the upside.
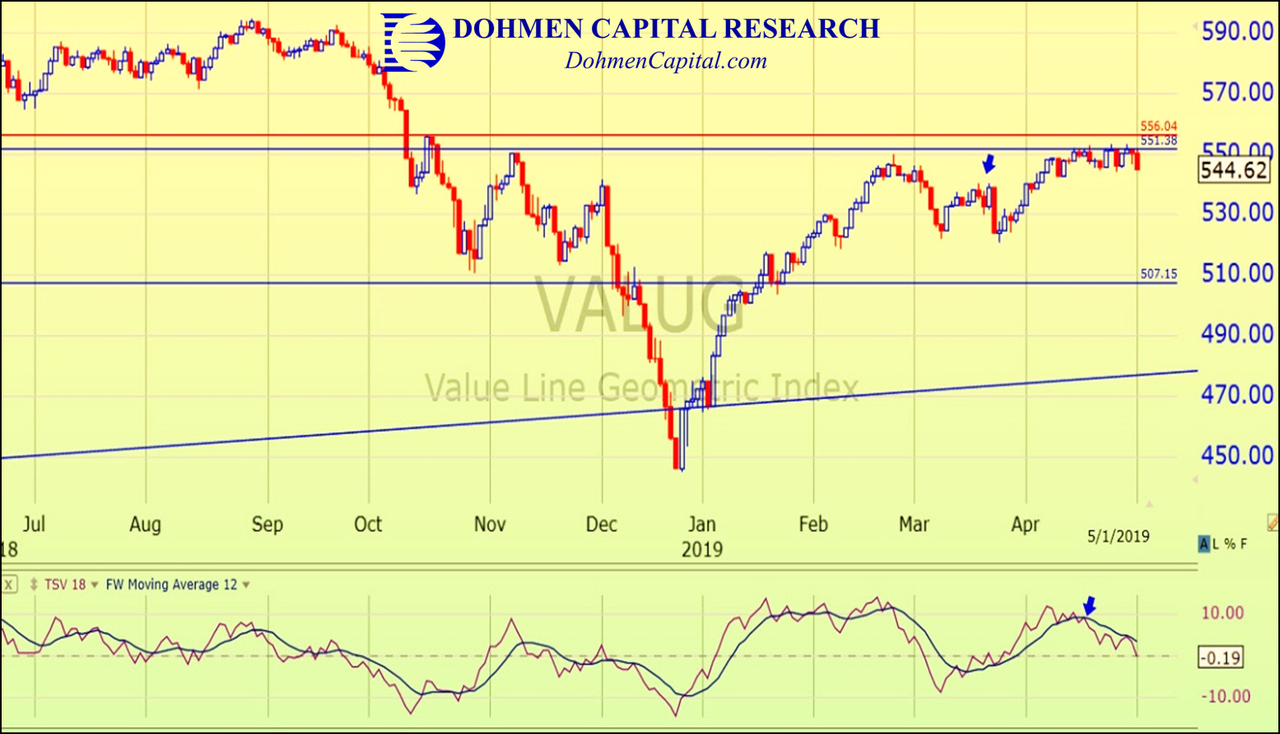
At this time, we find the most relevant index to be the Value Line (G) index, an index of more than 1600 stocks which are not cap weighted. Therefore it shows what the majority of stocks are doing, not just a dozen very big cap stocks that are manipulated. See the VALUG chart below:
The indicator at the bottom (time segmented volume) includes price and volume changes. That makes it very relevant. Note the sell signal came in mid-April, which so far is higher than where the index is today.
Also note that this index is still substantially below the August 2018 high, supporting our case that the rally so far this year was a bear market rally.
The oil sector is interesting now. We consider the price trend of oil very important for the entire stock market. If its price reverses downward now, it would remove a very important crutch for the market.
Money managers have accumulated huge long positions in this sector the past two months while reducing their shorts to negligible amounts. To us that spells excessive enthusiasm. When everyone gets on the same side of the fence, it’s time to go to the other side.
To be a successful investor, one must look ahead, not in the rearview mirror. We are getting sell signals.
We believe the bearish case will reassert itself this month. We are positioned for that.
Here you can see how important advanced chart and technical analysis is critical at times like these.
But we take it one step at a time. Volatility and the huge cross-currents require flexibility. At this part in the cycle, it is unwise to “buy for the long-term.”
Using our conflict-free analysis and research (we don’t manage money nor receive commissions), we were able to give timely sell signals ahead of this recent plunge, as well as ahead of the multi-trillion dollar plunge in the last 3 months of 2018, the global crisis of 2008, and all other major market declines over the last 42 years.
The above analysis shows how investors could have been prepared ahead of the recent plunge.
So, what’s ahead? Our longer-term analysis was written in 24 pages of our last Wellington Letter. Just remember, when just about everyone is bullish on the markets, it usually pays to be on the other side.
If we consider that at the end of May bearish sentiment had increased substantially, we are looking for a rally to squeeze the late short-sellers. However, will it last? We examine that among other key insights and clues we’re seeing now. The answer is extremely important for your investments.
Investors must consider that the recent market top was in a much more negative environment than the prior two, September and January 2018. Analysts seem be ignoring that. The headwinds going into the 2020 election will be enormous.
Our method is two-fold:
- We look at the fundamentals, especially in bonds and the credit markets, which are many times larger and much more important than stock indices. Most analysts in the media never mention those.
- And then we use advanced technical analysis to give the timing.
The majority is seldom, if ever, correct. Find yourself an analyst with the courage to go against the crowd, someone with a long-term track record. Decades of experience in the markets can be essential for superior results.
If you didn’t have our guidance before the latest selloff, you can now see how it could have saved you from incurring huge losses.
Wishing you good health and prosperous investing,

Bert Dohmen, Founder
Dohmen Capital Research
Dohmen Strategies, LLC