The current market environment reminds us of mid-February.
Investor sentiment is remarkably bullish even after the record-shattering crash from February to March. Of course, the Fed’s unfathomable support actions and stimulus have helped prop the markets up as they inject trillions of dollars into the financial markets.
Once again, the Fed’s liquidity is fueling “FOMO” (fear of missing out) as investors rushed in to catch the latest rally.
This is very similar to what we saw in the fourth quarter or 2019 after the Fed announced massive liquidity injections, i.e. several trillion dollars into the “repo” market.
In our new Special Report, “Why the Crash of 2020 Was a Historic Bull Trap,” we explain how that rally turned into an incredible market crash:
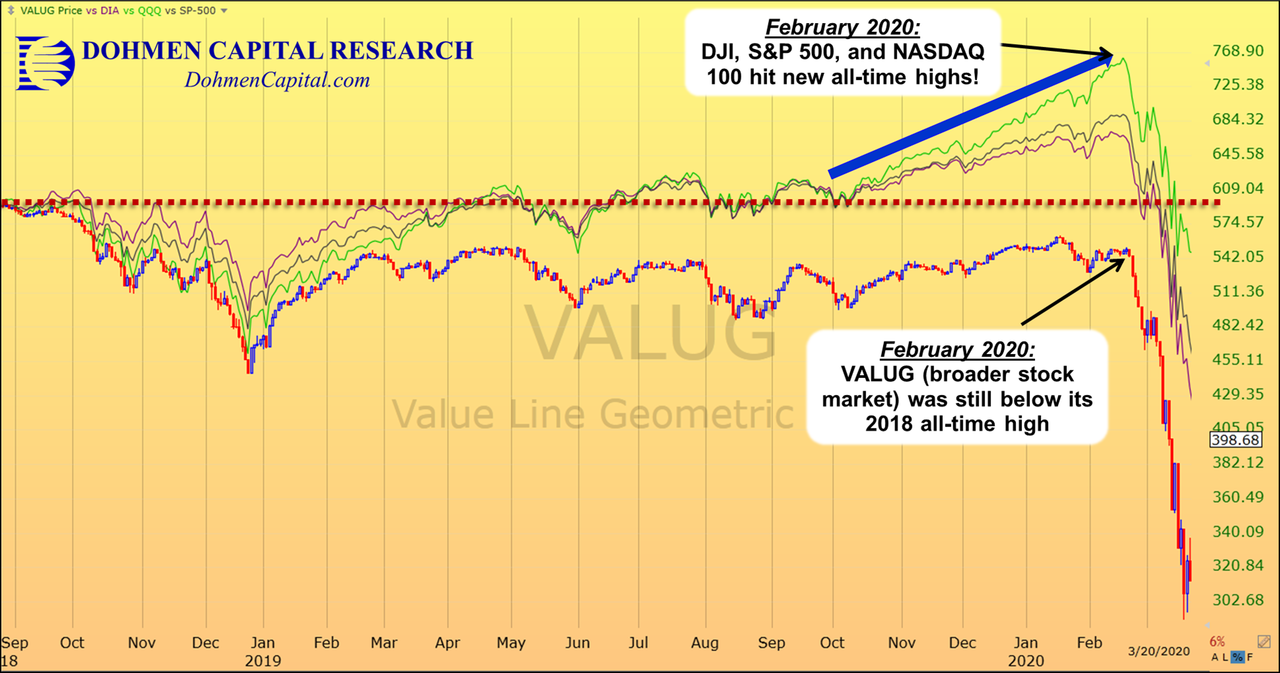
The markets quickly took off and made new record highs. In fact, the rally lasted into February 2020. But that final “blow off top” rally had all the earmarks of strong manipulation to make it look much better than it was. The much more important indices we follow did not even exceed their 2018 highs. It was clearly a trap.
We wrote about the dangerous divergences in the market and showed the below chart comparing the “true broad stock market” (VALUG) with the popular major averages such as the DJI, S&P 500 and NASDAQ 100 (QQQ).
About a dozen high capitulation stocks like Google, Amazon, Apple, and Microsoft, among others, were pushed up. Those stocks propelled the DJI and S&P 500 to new all-time highs. It was a perfect trap, just like we saw and warned our clients about in early year 2000.
Just like in 2000, “FOMO” (fear of missing out) was everywhere in the final quarter of 2019 and into early 2020. Even intelligent money managers, who warned of bearish signs, were forced to deplete their cash by jumping on board the bull market.
> Read our Free research report for our complete analysis of the Crash of 2020 <
Does the above sound similar to the current market environment? Which stocks have led the bounce since the March 23 low? The mega-cap tech stocks.
Recent data show that investor purchases of stocks during the rally were far greater than sales.
This just like what happened late last year and its typically very bearish behavior because the majority is always wrong at turns.
Over the past week, we saw bullish enthusiasm in the stock market getting into the “giddy” phase. The chart of the S&P 500 shows that the high for the rally is still April 29. But on financial TV we only hear about the big gains since the March 23 bottom.
Right now, the charts are looking negative. Take a look at the S&P 500 below. It tried to get above its 61.8% Fibonacci retracement level (red dotted line) last week into this week but failed each time (far right yellow circle), with Tuesday’s (May 12) attempt ending in a 2.1% decline. And as we saw the following day, Wednesday (May 13), the selling continued.
Additionally, the Stochastics indicator (bottom of chart) are in overbought territory and crossed over to the downside on Wednesday. This is another bearish signal.

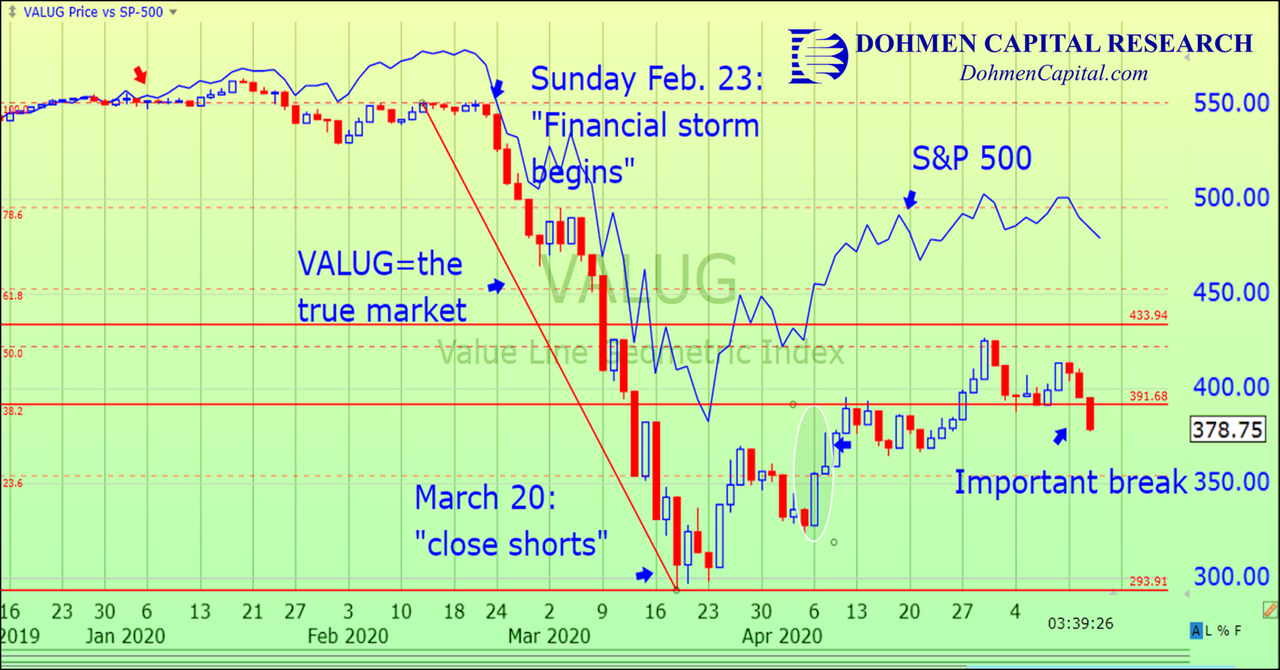
Also on May 13, the very important VALUG index (1660 stocks, equal weighted index) broke first important support. That could signal that the bear market rally of the past 7 weeks is over. If that is correct, we believe Phase 2 of the bear market is starting, which means the other indices will follow the VALUG down.
Take a look at the chart below showing the important breakdown in the Value Line index (VALUG) (candlestick chart) versus the S&P 500 (thin blue line). Note the huge divergence between the two indices. The S&P 500 is used for manipulation to give the idea that stocks are rising. Therefore, it is still being supported, along with the NASDAQ 100, in order not to raise the alarm bells before Wall Street is positioned for the coming plunge.
CONCLUSION:
It appears that investors were once again infected by FOMO, but will they regret it as they did just months ago? The recent rally was based on “hopes” that the virus will go away, a vaccine will be produced, and everything will be back to normal soon.
We have written for decades, “hope is not an investment tool. When you start using that world to justify an investment, it is a loud and clear sell signal.”
Make sure to get our free special report today to discover what our latest analysis shows about the incredible market plunge, the clues we saw that helped us forecast the crash, and what serious investors need to know now to prepare their portfolio for the coming turmoil.
Wishing you good health and prosperous investing,

Bert Dohmen, Founder
Dohmen Capital Research
Dohmen Strategies, LLC