The popular opinion is that the stock market has been soaring the past two years. But is that “fake” news, as so much other news is today?
Three indices have been pushed to new highs so far: the DJI, S&P 500, and the NASDAQ. But they don’t give the true picture of the real stock market.
For the general stock market, we at Dohmen Capital Research don’t use these indices, as they are not representative of the true market. The DJI is composed of only 30 stocks, while the S&P 500 is capitalization-weighted, which means it is dominated by about 20 stocks. The NASDAQ is also cap-weighted with a few big tech companies dominating the index. That means the index can easily be manipulated by HFT (high frequency trading) operations.
For a much more accurate gauge of the stock market we use the broad Value Line (VALUG), which consists of 1660 stocks, and is not weighted by capitalization. The chart below shows that index compared to the S&P 500 over the past three years. You can see that broad stock market (VALUG) is still below the high of last year while the S&P 500 (thin red line) is at a new record high. The broad market is still 9% below its high of 2018.
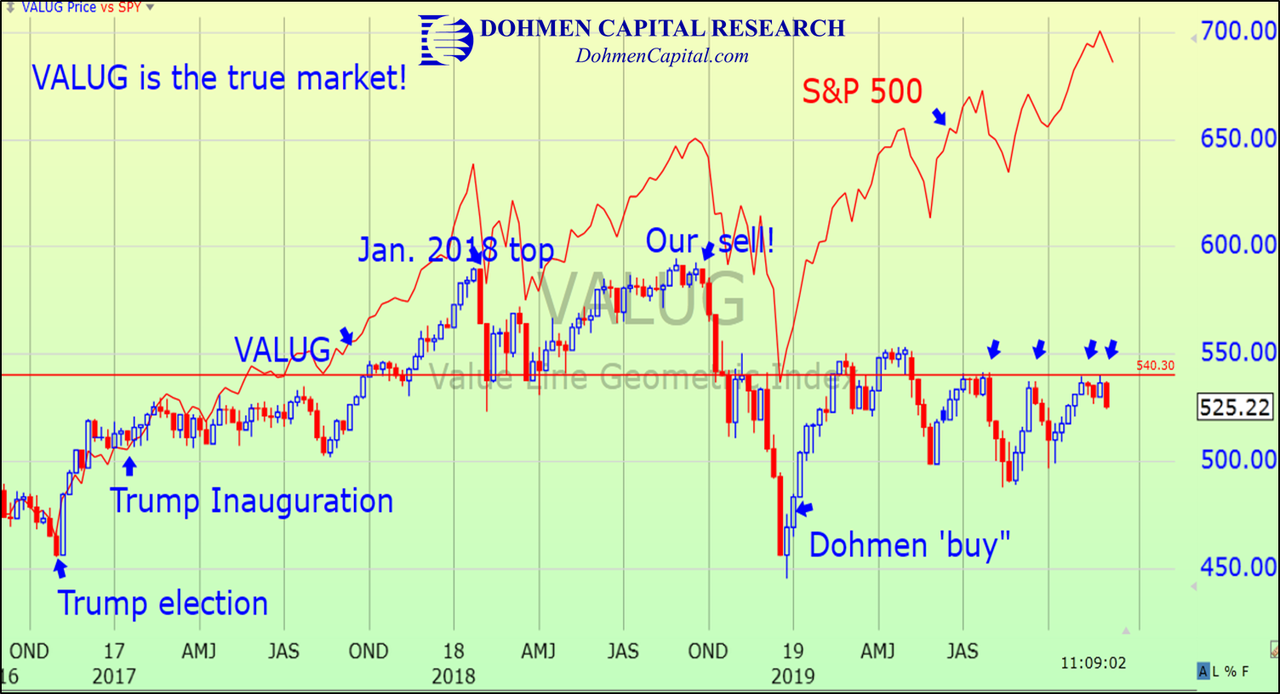
Look at the big performance difference between the manipulated, cap-weighted S&P 500 and the much broader and more relevant VALUG. The latter is the true market. See how so many analysts and commentators have been fooled?
Now that you know that the celebration of ‘new highs’ is so far misplaced, let’s see what stocks have really done vs other popular investments. Of the four asset classes below, the broad stock market is actually down from early January 2018.
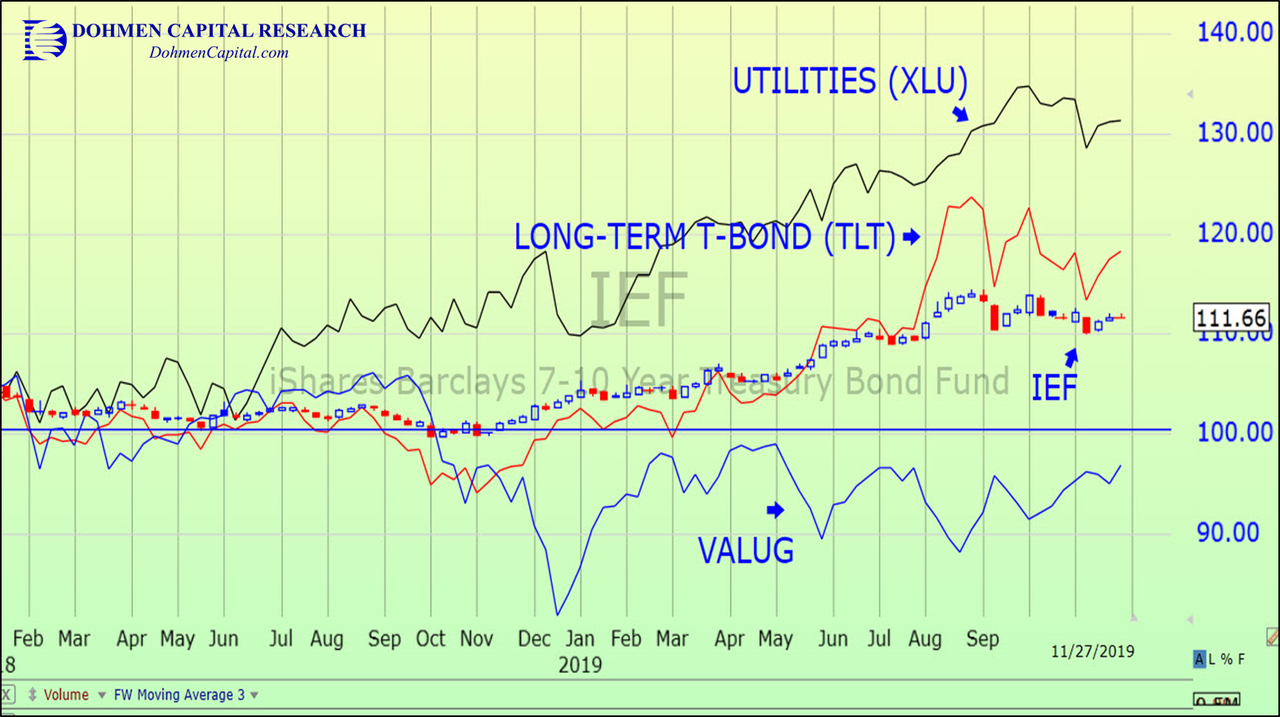
The best performer has been the Utility stocks, with good dividends, dependable income, and relative safety. Long-term T-bonds came in second place. The candlestick chart is the IEF, 7-10 year T-bonds.
You can see that with much less volatility, more conservative investments have done much better the past two years. Is this sending an important message about the future?
Investors became very cautious over the past two years, many preferring money market funds (MMFs). The chart below (courtesy of BAML) shows that in 2007-2008, they were eventually right when they did the same thing they’ve been doing recently:
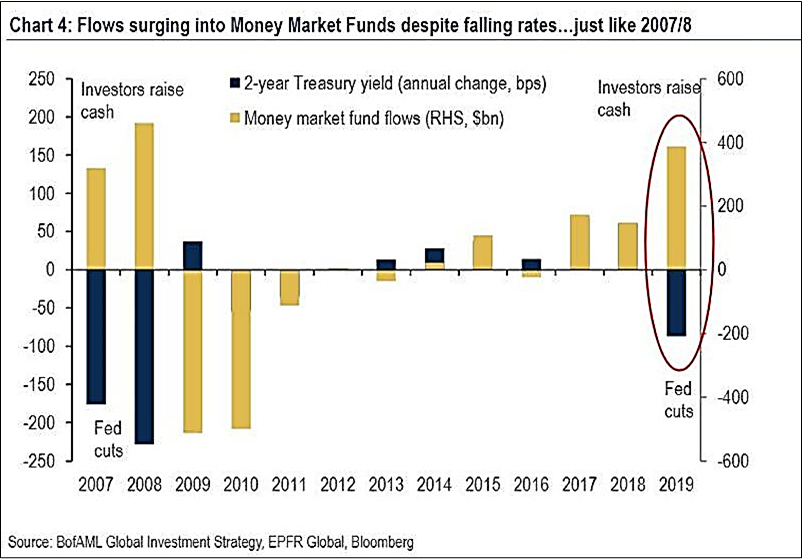
This is one situation where we cannot apply contrarian analysis, i.e., saying that caution on the part of many big investors is longer-term bullish for the market. It takes money, and buying of stocks, to make stock prices rise.
If that genuine investor buying is absent, although at the same time some stock indices are pushed to new highs anyway, we must get suspicious about a potential trap for the bulls being fabricated.
For example, the widely-watched stock market indices have soared to new record highs the past two months while many cautious money managers were sitting with high cash levels or defensive investments. Temporarily, that’s bullish, as they are now being forced back into the market. With a rising market, they don’t want to show high cash levels to their clients on the year-end reports, indicating that they missed the rally to new highs.
But that is usually a temporary buying spurt. You can imagine what can follow.
Over the past two years, important, traditional factors always mentioned by analysts in the media, most of which are irrelevant in the late stage of a bull market, no longer worked in their usual ways. Below are a three of examples:
- Earnings gains. In fact, earnings have declined every quarter this year and are expected to show another decline the current quarter. However, that hasn’t stopped three market indices from making new highs.
- Neither were the new highs in the major indices caused by a strong economy. In fact, economic growth has been weakening for the last two years.
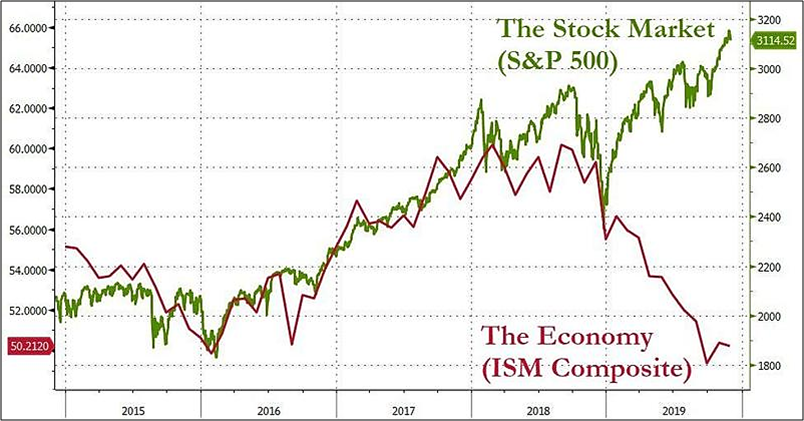
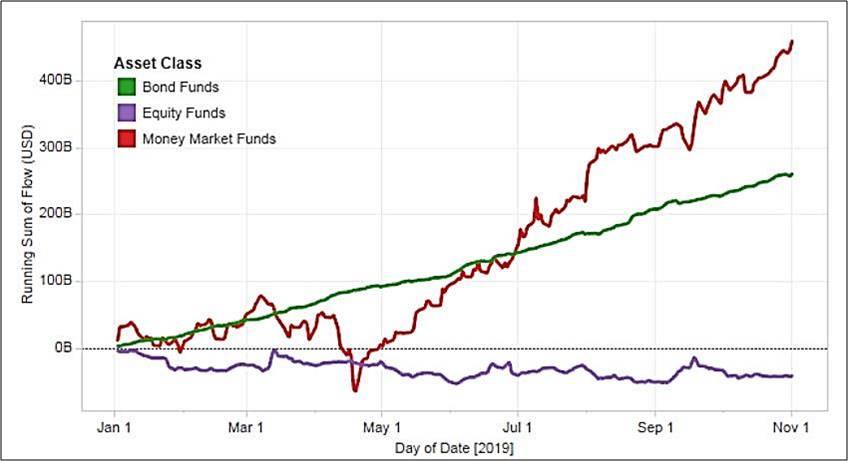
- Nor was the stock index rise caused by big buying from institutions, the traditional biggest stock buyers. In fact, they have been selling stocks all year. Note the line at the bottom.

The question posed by many investors and money managers is “what has caused the sudden surge upward in some stock indices since October?” In the media, we haven’t heard anyone identify the true source of buying. However, we had the answer on October 13, in our Special Bulletin to our Wellington Letter subscribers when we discussed the potential for liquidity injections by the Fed to prop up the markets.
On October 11, we wrote about “a game changer” in our trading services that that would eventually push all the negative factors to the backburner, at least in the near term.
This conclusion was based on our Theory of Liquidity & Credit developed several years ago. That has enabled us to predict the important market moves over the past 42 years. As we know now, it was once again correct. The markets started a new up-leg to new record highs just as I had forecast at that time.
The unknown is how long this effect will last. The Fed is so far only buying short-term T-bills. Of course, in case of a sharp stock market decline, they can change that quickly to include other securities.
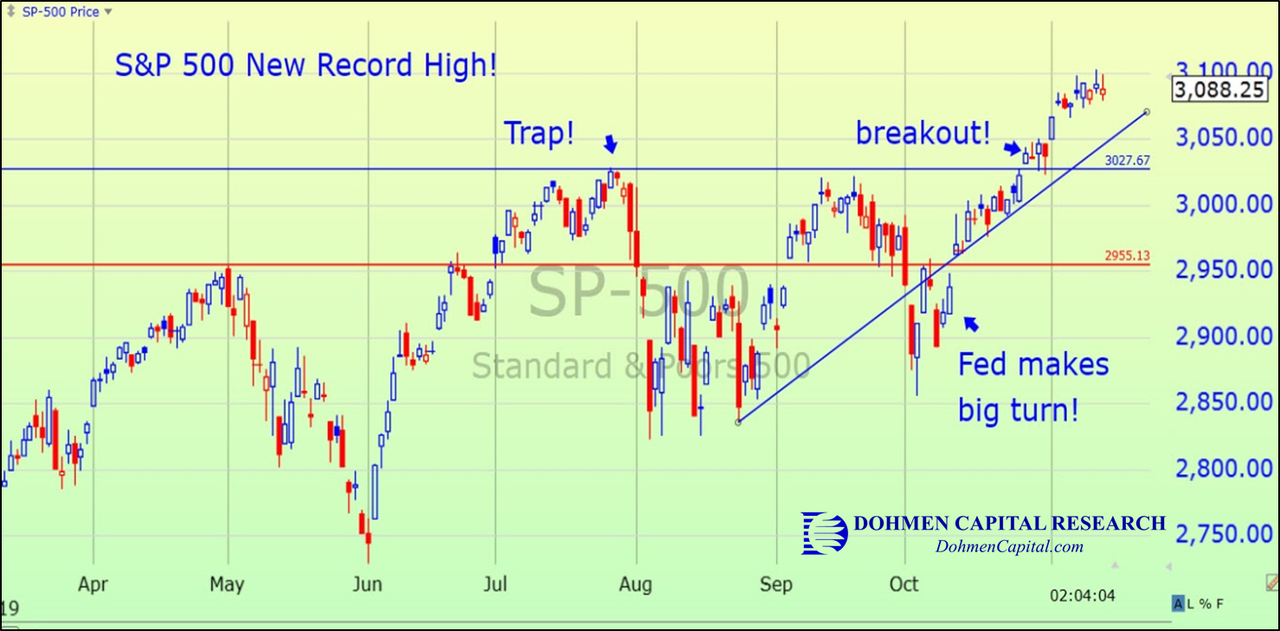
You can see on the chart below that the latest surge in the S&P 500 coincides with the Fed making the big turn in policy. The insiders apparently got the news about a week early, according to this chart.
We turned more positive on stocks in early October. Now that an even greater stimulus by the Fed is confirmed, we are confident that the market has support from the Fed. However, keep in mind there are times when the Fed and other central banks are overwhelmed. Remember the year 2008, or 2000?
It’s important to remember that only President Trump’s criticism of the Fed’s proclaimed “automatic” rate hikes in December 2018 woke up the Fed. They announced stopping the rate hikes, which was later followed by rate cuts. If it hadn’t been for the switch, we would probably be in a big bear market and recession now.
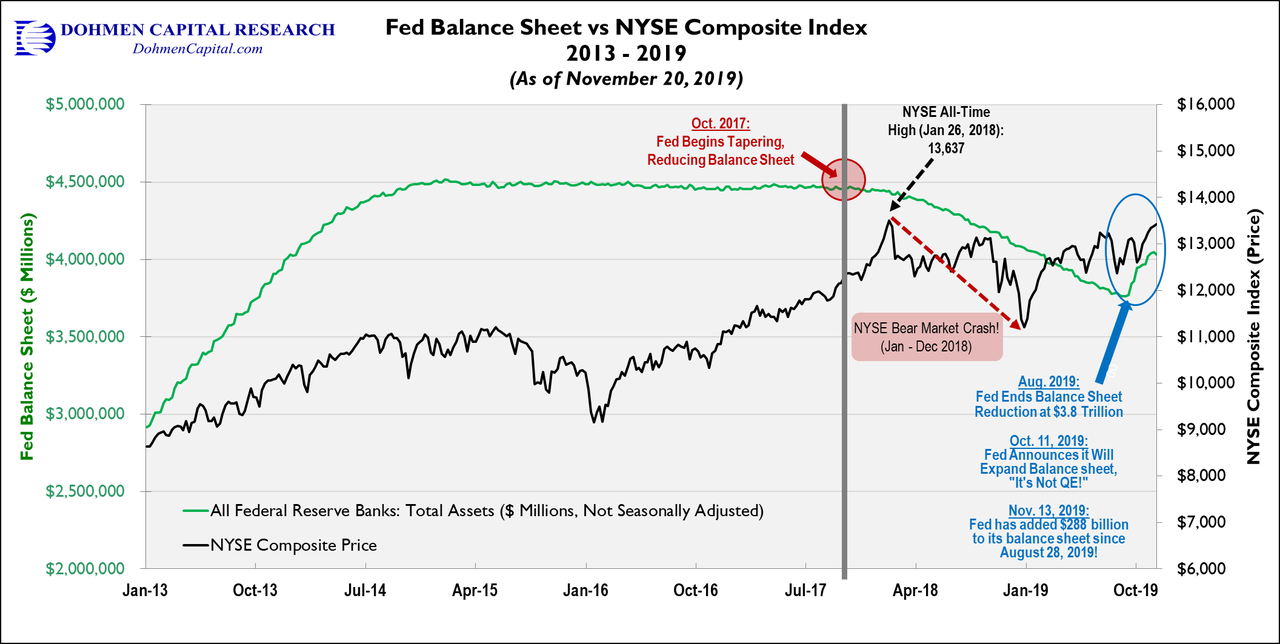
According to the data we have now, the Fed quietly started pushing liquidity into the system in early September. The data show an increase of $280 billion in liquidity injections in just seven weeks, much more than the $60 billion per month announced.
This is what caused the markets to rally to new record highs. Look at the chart of the Fed’s balance sheet soaring lately:
The rally in terms of the DJI so far is almost 2400 points since the start of October 2019. That’s the power of liquidity. The big question now: is that impetus exhausted?
Earnings are irrelevant during such bear markets, liquidity is everything.
Wall Street doesn’t tell you that during the bear market of 1973-1974, a major stock index lost 80% of its value. What did earnings do during that time? Earnings of the S&P 500 rose every quarter during that bear market. So much for the fiction that earnings drive the stock market.
CONCLUSION: The next year will be extremely important for investors and traders. Getting it right will mean the difference between painful losses and big profits. If you don’t have sufficient time to devote to your investments, get the best guidance you can afford.
Find someone who goes against the crowd and does a lot of original thinking. Just following those who parrot everyone else in the media is a losing strategy.
There is an old saying in the markets: “What everyone knows is probably not worth knowing.”
That goes for all the commonly discussed metrics such as earnings, dividends, P/E ratios, among others. Millions of people now can do easy scans of all stocks for these metrics free of charge online. There is no such thing anymore as “discovering” a stock with amazing metrics that only a few people know. That was true about 50 years ago.
Remember, “buy low and sell high.” That sounds obvious, but it’s amazing how many people do the opposite.
Wishing you good health and prosperous investing,

Bert Dohmen, Founder
Dohmen Capital Research
Dohmen Strategies, LLC