
Traders have had a lot to digest over the past few weeks, navigating markets riddled with election chaos, vaccine mania, and an uptick in speculative activity. The day to day cross-currents are incredible, the wildest we have seen in a long time.
For clues on where markets could be headed in the long term, however, investors should look beyond the daily headlines. On October 22nd, about four weeks ago, we alerted our Smarter Stock Trader members about a major shift we saw in the credit markets that seemed to go unnoticed in the financial media:
“We are now starting to see an interesting divergence between long-term Treasury bonds and the stock market. For most of this year, the major moves of bonds and stock prices were in the same direction. Now, however, they are moving in opposite directions.
Many analysts explain that the current divergence is the result of money flowing out of bonds and into stocks. We believe it is because of rising inflation expectations.”
This sector is more important than investors think. To illustrate the divergence that has emerged between Treasury bonds and stocks, we show the daily chart of the TLT (candlesticks) and the S&P 500 (red line). Rising stocks while T-bonds decline to us is a potential sign of inflation expectations.
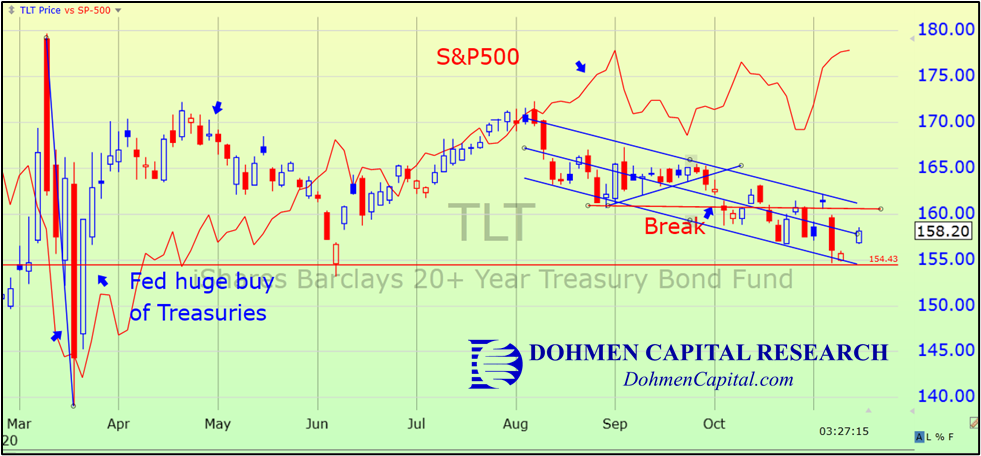
Until August, stocks (i.e. S&P 500, thin red line) and T-bonds went generally in the same direction. Then they started diverging, with the T-bonds heading south while yields rose.
The TLT has traded in a strong descending channel for the past 3 and a half months. It broke below key support in early October and tested support from the June lows. The plunge in T-bonds over the past several weeks says that a strong economic rebound or a rise in inflation seem to be expected.
In our opinion, this is capitalism at work! Inflation numbers will rise, as the Fed has suggested. That means we could see an environment somewhat like that of the late 1970s.
There are two main reasons for interest rates to rise:
1. Tight money, meaning hard to borrow, which is bearish for markets and the economy, and
2. Loose money, meaning easy to borrow, which leads to booms in asset prices and a stronger economy
The effects of #1 and #2 are totally different on the markets and economy. We watch Treasury bond prices and yields closely. Fundamentals tell us it should be #2, i.e. loose money.
We started our firm, Dohmen Capital Research, 44 years ago in 1977. Our first great market call was that bond prices would plunge at that time, totally opposite to Wall Street forecasts.
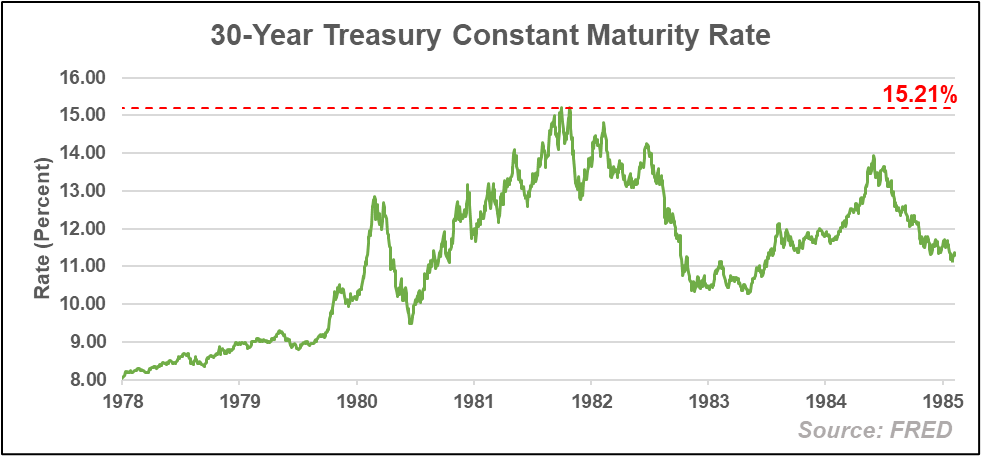
In 1978, one year after our business had started, we predicted that T-bond prices would decline by 40% to 50%, meaning the yield would be in the 15%–16% area.
The well-known chief economist of Goldman Sachs, at his seminar in my town, deemed my forecast “absurd” because such high bond yields would cause a collapse of the financial system.
We countered: not if inflation is high enough.
In fact, two years later, T-bond prices had declined 44%, with the yield of long-term T-bonds at over 15%, as shown on the chart below:
That put our Wellington Letter on the map, and requests for interviews poured in.
You see, in 1978, the popular notion on Wall Street was that rising interest rates would produce a bear market in stocks. Our position was that the declared policy of the Federal Reserve, which was not to fight inflation with tight money, but to do it through interest rate policy instead, would make stocks inflation hedges as rates rose and companies raised prices to recoup higher costs.
That is exactly what happened.
The stock market continued in a bull market until 1980, while the T-bond market virtually collapsed. The prime rate peaked out at 21.5% in December 1980. Stocks rose while interest rates soared to double-digits! We don’t know anyone else who predicted that.
Currently, the charts seem to say that we could see something similar on the horizon. The chance of the Fed tightening money is probably zero, and more stimulus is expected. The stock market suggests that stocks may be the “inflation hedge” as we correctly identified in the late 1970’s.
If these signals stay in place, it would mean higher inflation over the next several years, which is exactly what Fed chairman Powell has warned about. They know that excessive money creation cheapens the purchasing power of the dollar, causing prices to rise.
For the U.S. Treasury, there is a benefit of the rising inflation: reducing the Himalayan mountain of debt in after-inflation terms.
This would be very bullish for stocks, even in emerging markets. It could also cause an eventual precious metals boom like we saw in the late 1970s. This would validate forecasts from our long-term cycle study of gold prices, which correctly predicted a 20-year bear market for gold prices after 1980, which would then be followed by a 30-year bull market. So far, that long-term projection is right on target.
You can read more about our outlook on gold in our Special Report: “Why Gold Could Rise for the Next 10 Years.”
The above is a little history that fooled just about all analysts in the late 1970s, but it didn’t fool our valued subscribers. It will be very interesting to see if it happens again.
If it does, we just have to go back to the Wellington Letters of 1978-2000 when our subscribers had the opportunity to make great profits, while Wall Street wondered how inflation and interest rates could go double digit and stocks rise. Our valued subscribers knew the answer.
Wishing you good health and prosperous investing,

Bert Dohmen, Founder
Dohmen Capital Research
Dohmen Strategies, LLC