Warren Buffett is not a fan of gold. In his annual letter to investors earlier this year he wrote:
“Those who regularly preach doom because of government budget deficits (as I regularly did myself for many years) might note that our country’s national debt has increased roughly 400-fold during the last of my 77-year periods.
“That’s 40,000%! Suppose you had foreseen this increase and panicked at the prospect of runaway deficits and a worthless currency. To ‘protect’ yourself, you might have eschewed stocks and opted instead to buy [3.25] ounces of gold with your $114.75 [Buffet’s first investment 77 years ago].
“And what would that supposed protection have delivered? You would now have an asset worth about $4,200, less than 1% of what would have been realized from a simple unmanaged investment in American business.
“The magical metal was no match for the American mettle. [$114.75 would have grown to $606,811 if invested in a no-fee index fund tracking the S&P 500.]”
Our View: Buffett’s example is deceptive. It examines the performance over the last 77 years, whereas the gold price was in fact fixed by US law until 1975, almost half of that time period. Is that an honest comparison?
So let’s see what gold did since 2001 when we gave a renewed long term “buy” signal. In 1981, after gold had made its top above $800, we had predicted a 20 year bear market just when many gold bulls predicted a run to $3000. It happened!
Gold plunged to about $250 by year 2001. At that time, no one even wanted to hear the word “gold.” Bearish sentiment was at extreme highs.
But our work showed it was a great opportunity for the next long-term phase of the bull market.
In 1981, we had written that that according to the cycles, the 20 year bear market would be followed by a 30 year bull market in gold starting in 2001.
The start was right on target. Even we were amazed at the accuracy of that cycle. Often cycles deviate to the right or the left.
The big question now is if the bull market that started in 2001, will it extend for 30 years? That’s would be another 11 years from now. We don’t know, but so far the cycles have been correct since 1981.
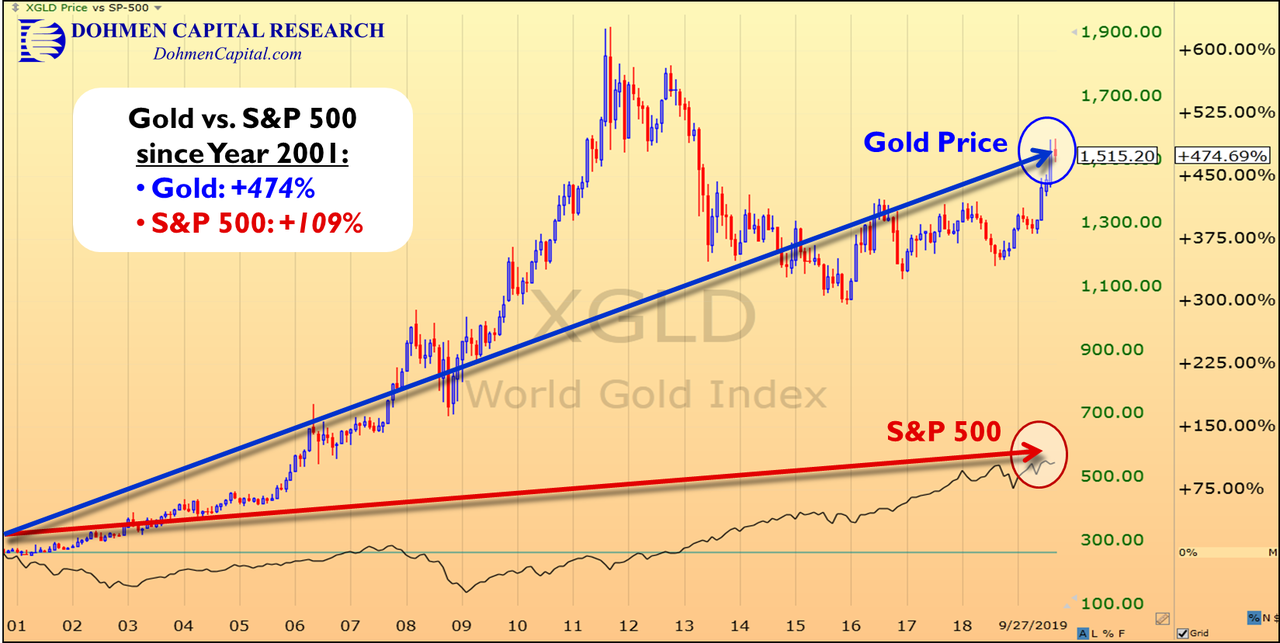
Let’s go back to stocks versus gold. The chart below shows GOLD (candlesticks) compared to the S&P 500 (black line).

As you can see, Gold far outperformed the S&P 500 since 2001. Buffett uses arbitrary dates, similar to many stock analysts who want to make a point against gold. They pick the dates that give them the results they want. It is disappointing.
We picked 2001 as a starting point according to our long-term signals, which indicated a bottom had been made at that time.
One analyst on financial TV recently said that “gold has been a horrible investment.” He didn’t give a time frame. Obviously, looking at gold’s recent performance, he is totally wrong. He manages stock portfolios.
Is gold competition for managed accounts in stocks? It shouldn’t be because it is an asset class, which have performed very well for our HedgeFolios membership program (not a managed account, which we don’t offer) this year.
However, there are times when an investor might want to sell when conditions are ripe for a sharp intermediate-term decline that may take months. During the 2008 global crisis, the gold miners ETF, GDX, plunged 72% during 8 months, while GOLD declined 31%.
That showed that when hedge funds dump assets during the start of a bear market in order to raise cash, they also sell this sector.
But then both recovered nicely over the next three years.
In our work, we try to catch those downturns.
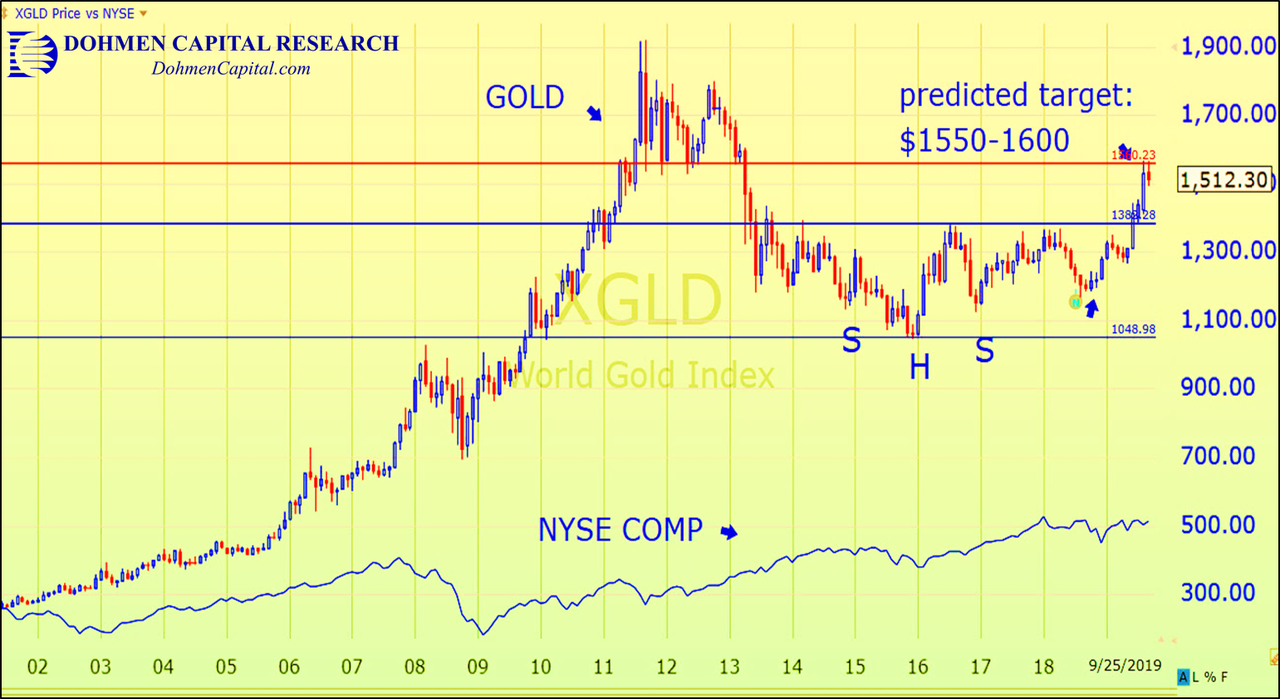
When comparing Gold performance, let’s use a broader index than the S&P 500, such as the NYSE COMPOSITE (blue line). Here is the chart of both. The outperformance of gold is even greater than against the S&P 500, about 3:1.
Lesson: Be skeptical. Verify everything you hear on TV or in other media. Check if there are any conflicts of interest in your advisor or the source of your information. Find the most experienced analyst with the best track record.
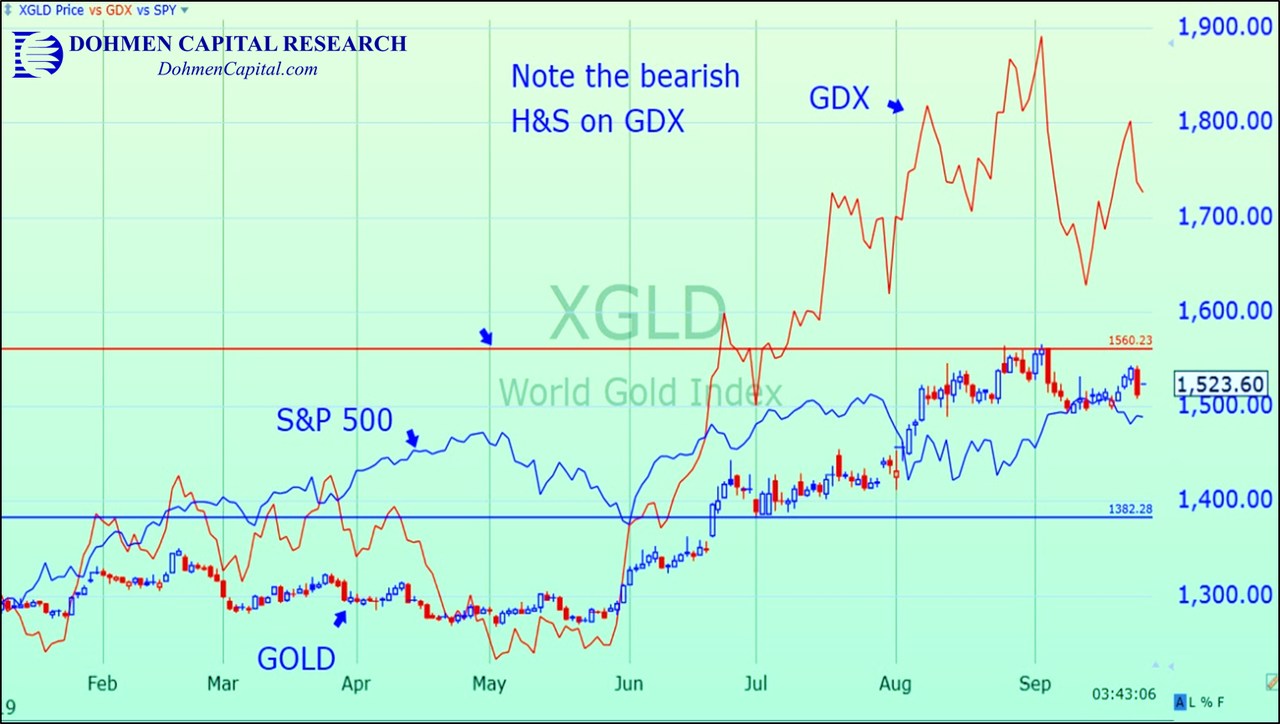
In our free research report on gold, published early April this year, we concluded that evidence of another big surge in gold was ahead. Since that time, the Gold Miners ETF, GDX, climbed over 49% to its September high. (We don’t sell gold/silver investments, we have no conflict of interest, and get only paid by our members for our research and forecasts.)
The above chart shows 3 investments in 2019: GOLD, gold miners ETF (GDX), and the S&P 500. Note the great outperformance of GDX.
Also note that with bullish sentiment at extreme high levels, this is probably not the best time to buy gold for a while. If you missed latest big up-turn, it might be good to wait. There will be better opportunities. We will work hard to identify those for our clients.
Some speculators like more excitement in their trades, such as crypto-currencies, which go up or down 20%-30% in 24 hours. In exchange for your money you get a computer entry, nothing tangible.
Eventually, these cryptos will be regulated out of existence. The central banks can’t tolerate private entities overtaking their role of creating money out of thin air. I prefer something the central banks of the world by many tons of: gold.
On a quarterly basis, central banks increased their purchases of gold immensely in the first quarter of 2019. The World Gold Council reports that first-quarter 2019 purchases were the highest in six years, rising 68% above the year-ago quarter.
Early this year the World Gold Council reported that central banks around the globe bought the most gold in 2018 in over 51 years. According to the report, last year Central Banks bought 651 tonnes (metric) of gold. That is an increase of 74% from 2017.
The biggest buyers were China and Russia.
Gold will become the most desirable asset when the central banks restart their QE (quantitative easing) programs in order to avoid devastating recessions. The purchasing power of money will be eroded significantly.
The central banks are already pushing bond yields below zero with over $17 TRILLION of bonds yielding below that level. That means that the buyer of these bonds actually pays interest instead of receiving it.
That is the first time in 5000 years of civilization that this experiment has been tried. It won’t end well!
The dangers of negative yields are recognized by the big smart money. Therefore, numerous countries are now buying large amounts of gold.
CONCLUSION: Chart readers will recognize that the above charts are long-term bullish. However, no market goes up in a straight line. Major upside resistance levels are ahead and will probably produce a sharp setback to chasten the perma-bulls.
The role of corrections in gold are to “shake the tree,” i.e. to separate weak holders from their holdings.
For many investors, it may be a good idea to have two portfolios:
- One longer-term hold portfolio
- One shorter-term timing portfolio to take big profits when everyone is bullish as now, and buy when bearishness is everywhere.
Most people cannot withstand sharp corrections and usually sell out at the bottom. That’s why often, depending on the individual, it is better to get out when technicals call for it, and get back in at lower prices. Only very experienced analysts can do that.
You will certainly not make 50% every 2.5 months in gold stocks, but you will be confident that gold-related investments will be a better asset for the very long term at this part in the cycle. If you buy it near the end of a correction, you can do even better.
I always look for investments that have something of value. It lets me sleep at night.
Wishing you good health and prosperous investing,
Bert Dohmen, Founder
Dohmen Capital Research
Dohmen Strategies, LLC


