
Most analysts still hang on the false conclusion of a “strong labor market” and how it is a key factor to their “new bull market” thesis. Don’t these people read?
Didn’t these analysts hear about the huge layoffs, with the biggest companies in the tech sector now reaching a total number of laid-off workers well over 200,000 over the past year?
Guests and commentators on Financial TV are getting downright giddy again about the stock market and the economy. On Bloomberg last week they talked about a “super-strong and tight labor market.” Obviously, they believe the false numbers from the government.
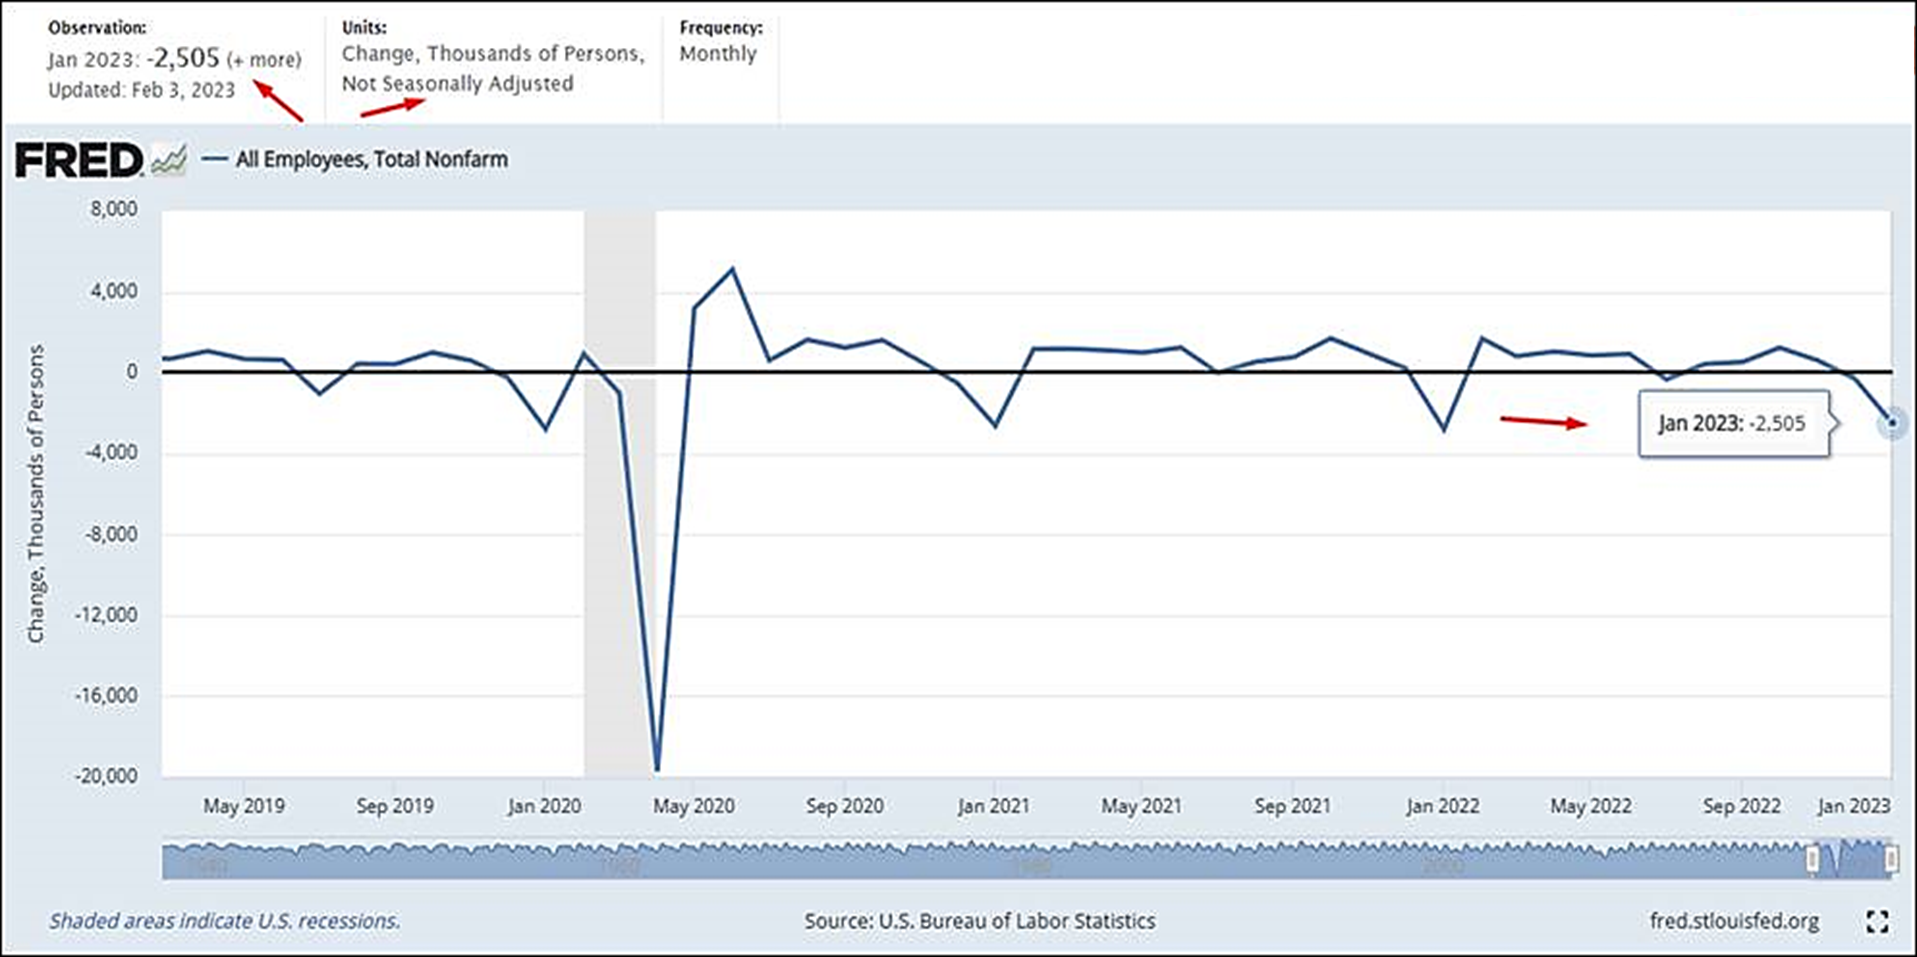
The employment numbers released by the Bureau of Labor Statistics (BLS, aka Bureau of “Lying” Statistics) last Friday (February 3rd) added fuel to the fire. Their report said that employment allegedly increased by an amazing 517,000 jobs (on an “adjusted basis”) in January.
According to the BLS website, actual (“unadjusted basis”) U.S. employment fell by 2.5 million jobs — many of those being temp workers. That means the actual number of jobs added is 3 million jobs less than advertised. AMAZING! See the chart below showing the true unadjusted employment data for January.
COMMENTS FROM ECONOMISTS:
- Chief economist Bill Adams of Comerica said recently. “It is a super strong report, but it doesn’t mesh with the other data we have on the economy.”
- ING’s chief international economist, James Knightley said, “A real surprise, which is difficult to explain.” (Our comment to him: read the BLS website)
- Richard Moody, chief economist of Regions Financial, said, “If those numbers seem too good to be true, they pretty much are.
Part of the explanation: Each January the BLS revises its formula of the past 5 years. As explained above, actual “unadjusted numbers” show that the economy lost 2.5 million jobs, which is much greater than normal.
Again, the difference between the actual number (a loss of 2.5 million jobs) and the headline “adjusted” number (+517,000 jobs) was over 3 million jobs, the biggest difference since 1995.
Why did seasonal adjustments show an increase of 517,000 then? The government estimated that far fewer people were laid off in January than is usually the case. Why? Perhaps because the State of the Union Address was coming up and therefore showing a loss of 2.5 million jobs would not have been beneficial to Washington.
We have warned for years not to believe the employment statistics coming out of Washington, especially the BLS. In fact, the White House (WH) has used false labor statistics repeatedly to perpetuate the fiction that the labor market is strong. This is not the first time. BLS numbers are mostly political.
This is a good time for investors to start a list of analysts you want to ignore now and in the future. Consider ignoring any analyst who gives credibility to the employment report. If an analyst doesn’t take 30 minutes to go through the BLS website, we would not consider his/her view of any topic having credibility.
Recently the Philadelphia Federal Reserve wrote that in second quarter of 2022, the Biden administration had overstated job growth by 1,047,000 new jobs. The WH has used that false number repeatedly in its statements.
The Philly Fed’s revision said the actual number was closer to 10,500 jobs.
Imagine, economists and analysts use such grossly false numbers in their projections of the economy and the stock market.
The report also suggested that “the BLS had understated unemployment figures in 29 states and D.C. by significant margins, which would mean Job growth was basically flat during that period.”
Imagine that! This is what China does. Other governmental actions in the US also mimic methods used in China, such as camera surveillance, coercion of the media, suppression of thought and speech about freedom, and personal rights, among others.
TRUE UNEMPLOYMENT DATA: The BLS appears to be a political agency, not in business to deliver meaningful numbers.
True unemployment is 24.5% according to shadowstats.com. The BLS method is to ignore the people who have not had a job in one year. Therefore, these people are NOT counted as “UNEMPLOYED.”
Dr. John Williams of shadowstats.com calculates the real numbers without all the political fabrications that present a totally false picture.
But now we hear from the top of the US government that unemployment is the lowest in many decades.
Larry Lindsey, former chair of the President’s Economic advisors, said on CNBC this week that Fed Funds must come up above the rate of inflation (CPI). That would be from 4.75% to around 7%. He said, “we are coming down from a historic big party and there will be a big hangover.”
Our members will recognize those statements of Lindsey because that is exactly what we have written for over one year; the hangover will be proportionate to the amount of “fun” had at the party (i.e. the market rally over the past few years).
We are pleased that at least some reputable people like Lindsey has the courage to go against the fairy tales spun by Wall Street analysts every day, like a “red hot jobs market,” ignoring the huge layoffs by large companies, and all the employee reductions by thousands of other firms.
Everyday we see the job cuts continue, with one major firm after another announcing layoffs. According to one report, job cuts in January were around 75,000 from large firms. That doesn’t confirm a “hot jobs market.”
In January, analysts in the media continued to suggest that layoffs are simply coming from tech companies that “over hired” during the boom. That is so FALSE!
Read about many non-tech firms announcing large layoffs (one article: https://tinyurl.com/3a5wmjn3). To ignore that fact every day suggests that even the financial media may have joined the propaganda cartel.
MARKET IMPACT: The phony employment report was greeted with much enthusiasm although to us and a few others, it obviously and intentionally created to give a false picture. It led to a big intraday rally on Friday, the day of the BLS employment report, only to be sold off by the close.
A number of important stock and index charts formed negative candlesticks. Since then, stocks have sold off 4 of the past 5 trading days.
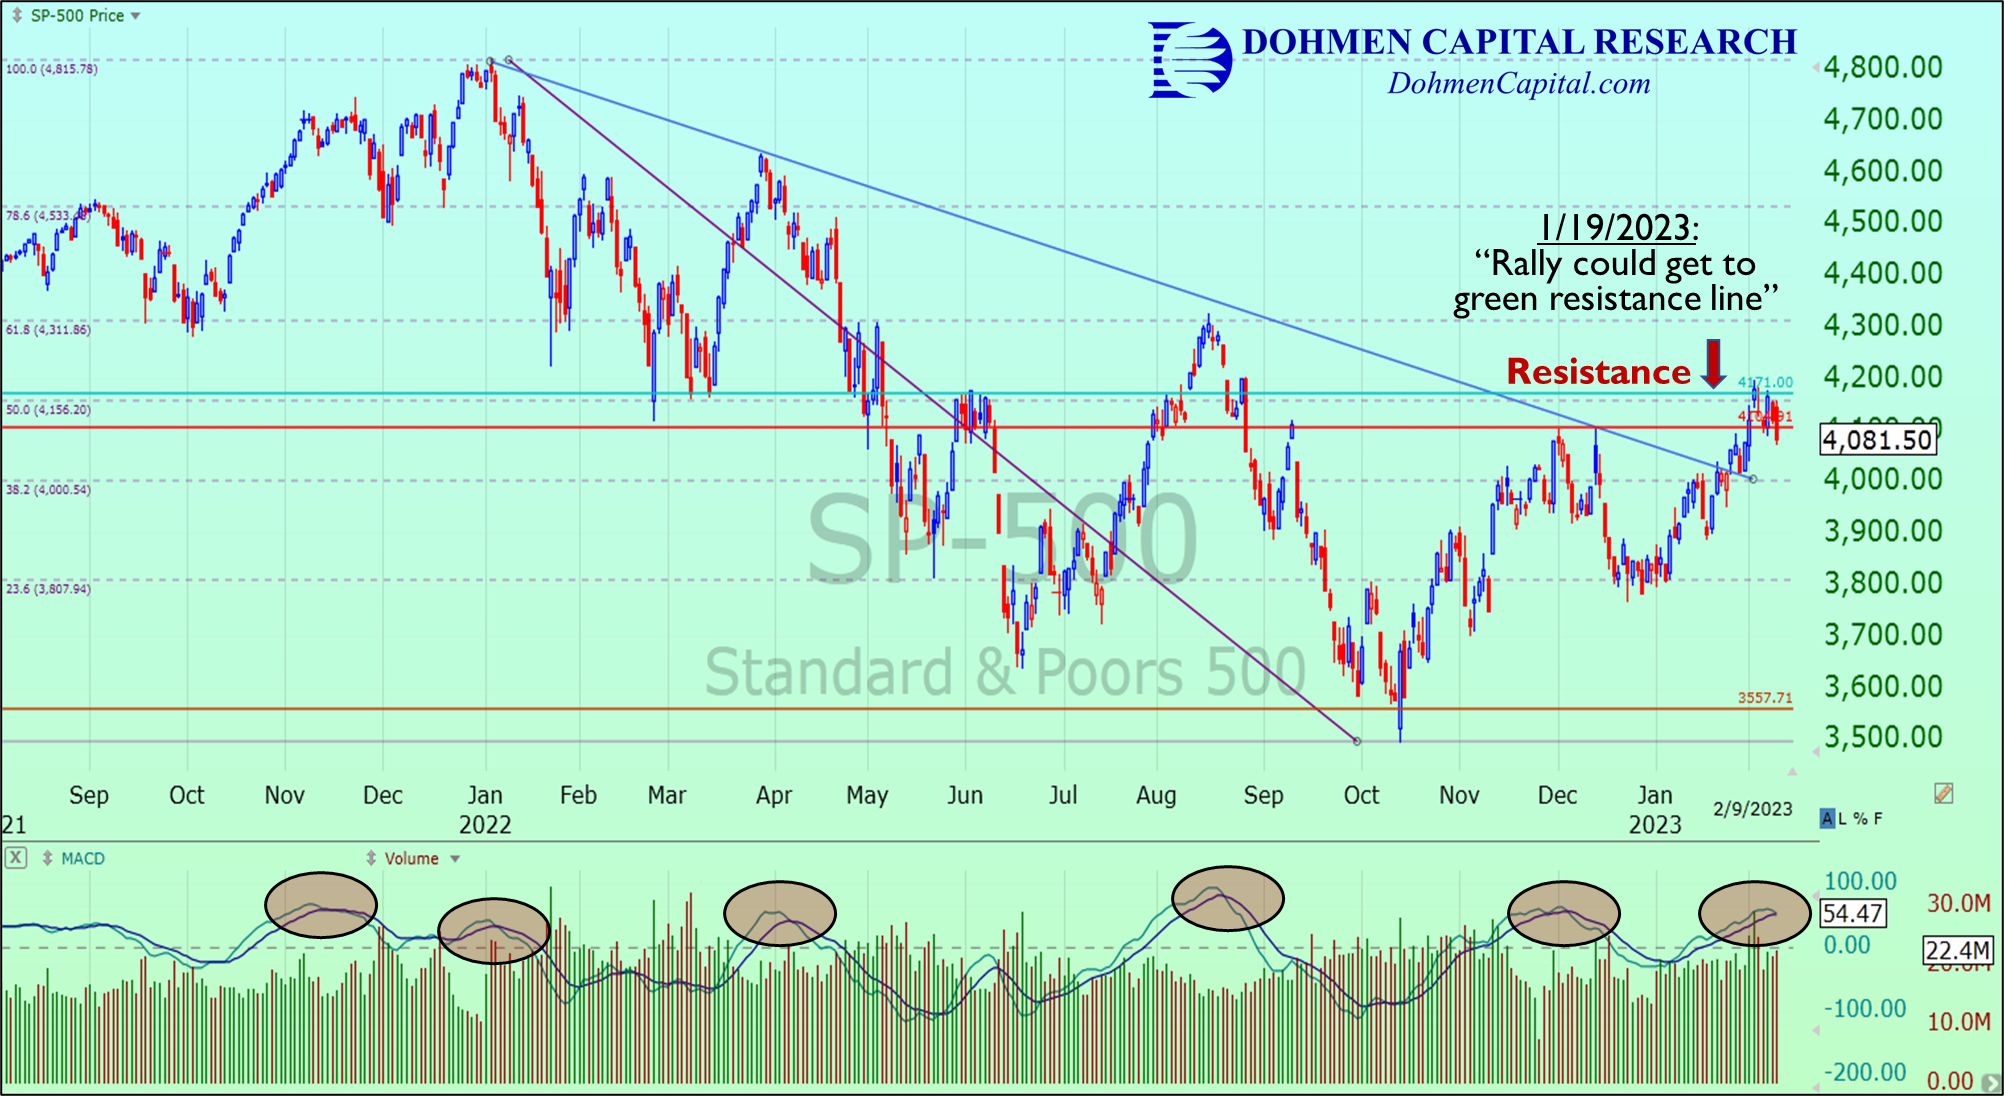
Investors are now wondering whether the latest market party (rally) ended last week or not. Many of the major indices hit our green resistance lines, which we marked on January 19th for our Smarter Stock Trader & Fearless ETF Trader members.
See the daily chart below of the S&P 500, showing our target resistance level was reached on February 2-3, 2023, where the index was rejected. The MACD indicator (bottom) appears to be on the verge of crossing over to the downside. Other times it did this over the past 16 months, the S&P 500 has plunged every single time.
However, if the rally does continue, we believe it will eventually lead to another big hangover a little later. Although anything is possible, we think the next meaningful trend reversal should be followed by a potentially severe continuation of the bear market.
Read more about our latest market and economic analysis, research, and forecasts in our award-winning Wellington Letter, now in its 47th year of successfully guiding active investors.